PietroMonticone
pitmonticone
pit
Dashboard" />
class: center, middle, inverse, title-slide # Liberi, Oltre Le Emissioni ## <em>Sustainable Decarbonization</em> <br><br> ### Pietro Monticone | UniTO <br> <a href="https://twitter.com/PietroMonticone"><i class="fab fa-twitter "></i> PietroMonticone</a> <br> <a href="https://github.com/pitmonticone"><i class="fab fa-github "></i> pitmonticone</a> <br> <a href=""><i class="fab fa-youtube "></i> pit</a> <br><br> <a href=""><i class="fas fa-link "></i> Dashboard</a> <br><br> ### Ca’Foscari Venezia | 15/02/2020 --- name: climate-problem class: center ### Climate Change: **A Stock-Flow Problem** .right[<small> **Source**: [IPCC SR15 (2018)](https://www.ipcc.ch/sr15/) </small>] 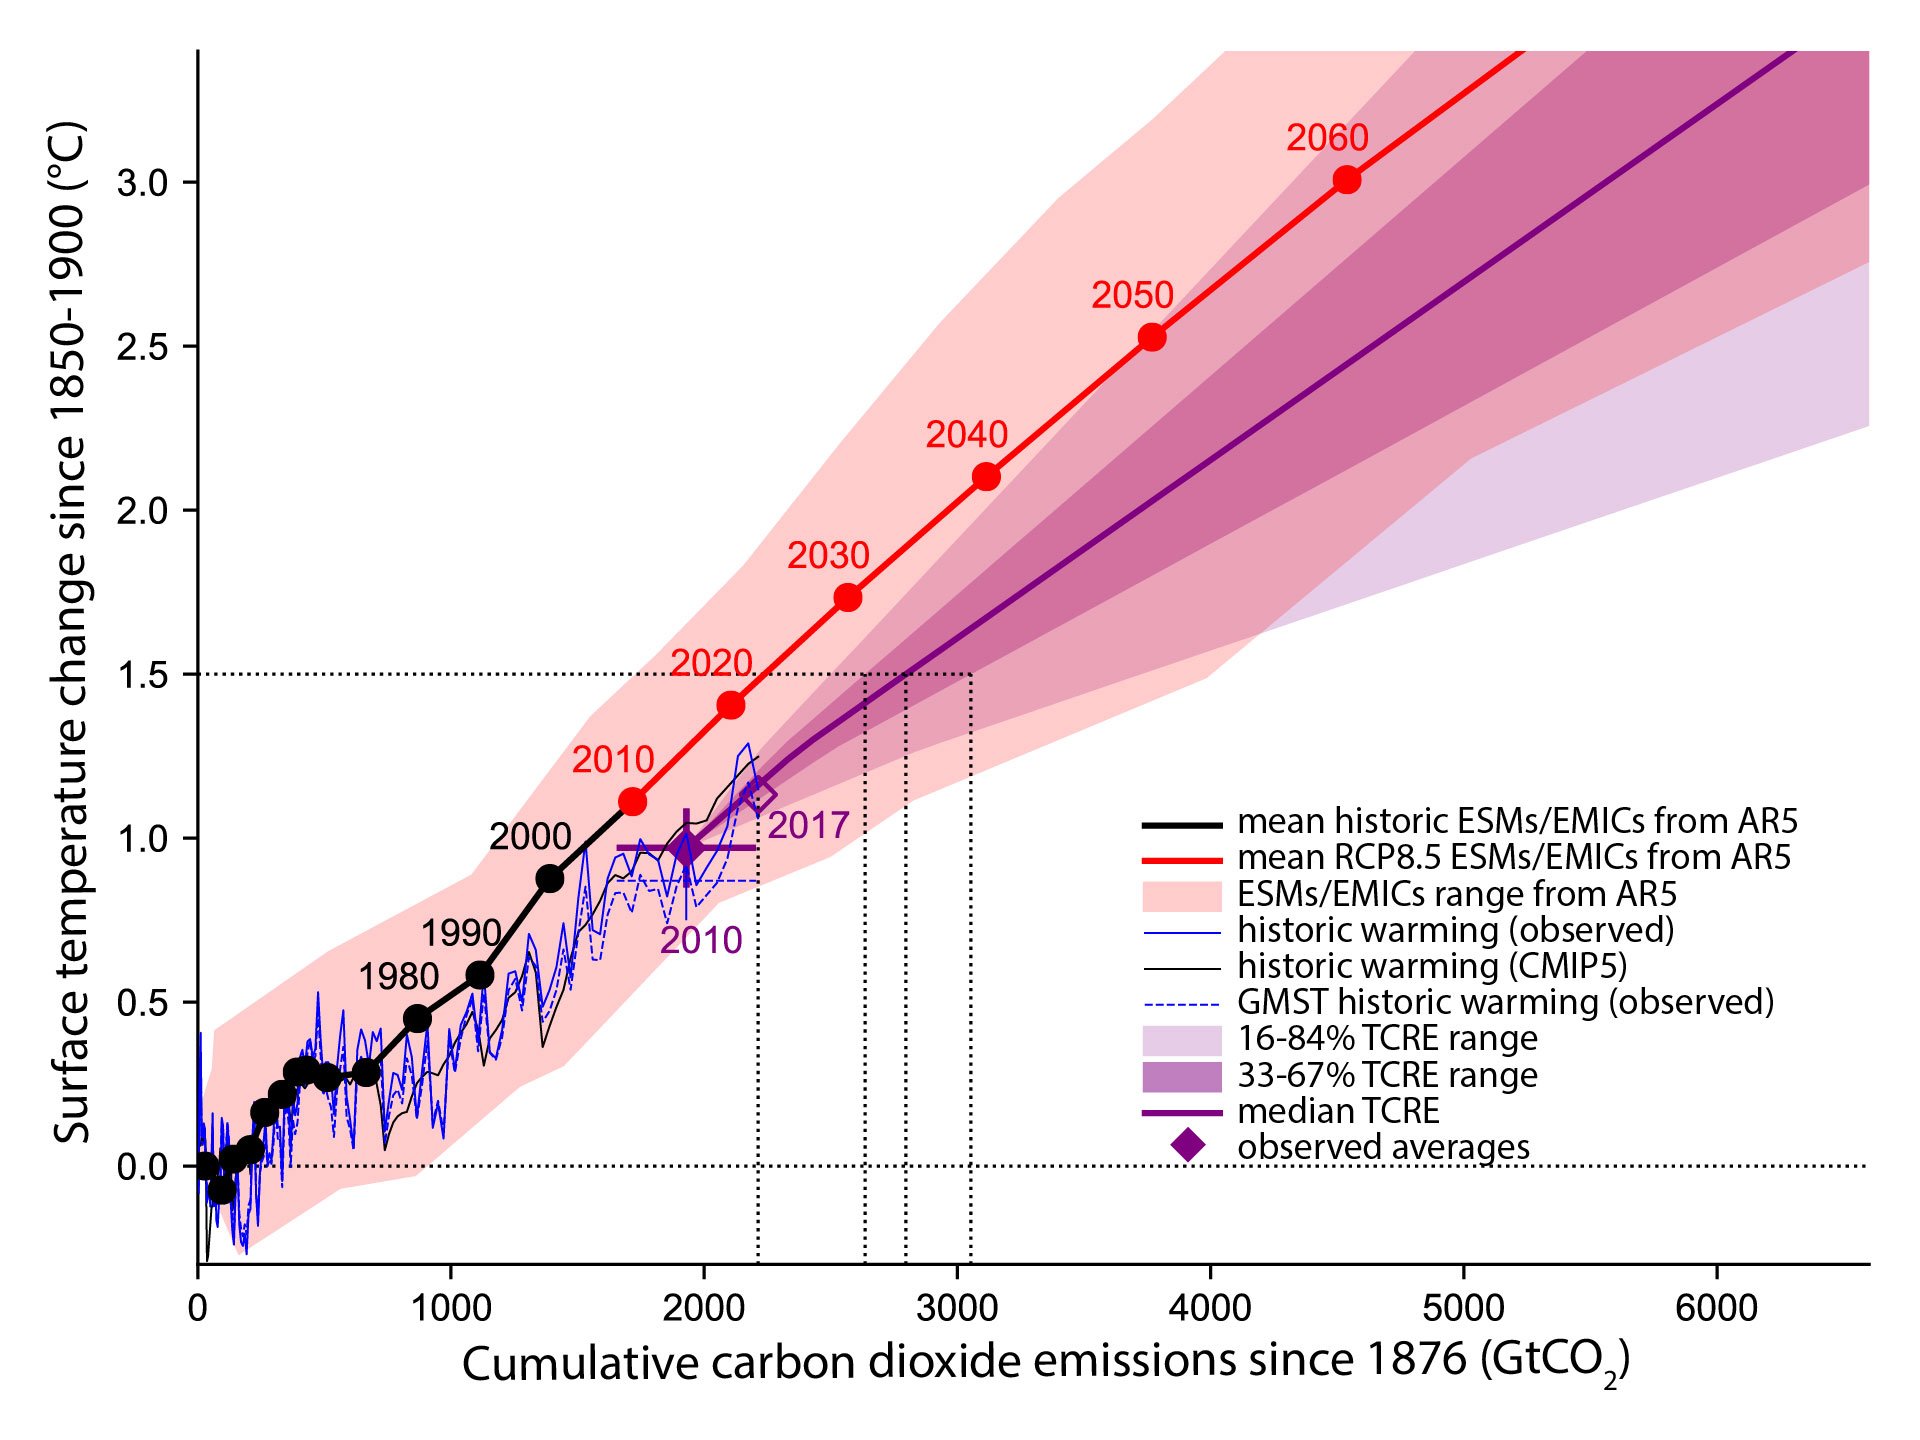 --- name: carbon-budgets class: center background-image: url(figures/glen-peters/carbon-budgets.png) background-position: center background-size: contain ### Climate Change: **Carbon Budgets** .left[.footnote[<small> **Source**: [Glen Peters](https://www.slideshare.net/GlenPeters_CICERO/if-25c-is-easy-why-is-2c-hard) </small>]] --- name: climate-mitigation1 class: center ### Climate Change: **The Mitigation Challange** .pull-left[ ](https://www.ipcc.ch/site/assets/uploads/sites/2/2019/02/SPM1_figure-final.png) ] .pull-right[ ](https://www.ipcc.ch/site/assets/uploads/sites/2/2019/02/SPM3b.png) ] .left[.footnote[<small> **Source**: [IPCC SR15 (2018)](https://www.ipcc.ch/sr15/) </small>]] --- name: climate-mitigation2 class: center ### Climate Change: **The Mitigation Challange** .pull-left[ <iframe src="https://ourworldindata.org/grapher/co2-mitigation-15c" style="width: 100%; height: 550px; border: 0px none;"></iframe> ] .pull-right[ <iframe src="https://ourworldindata.org/grapher/co2-mitigation-2c" style="width: 100%; height: 550px; border: 0px none;"></iframe> ] --- name: conceptual-framework class: center, top ### Conceptual Frameworking .pull-left[ .left[ **Three Classes of Common Mistakes** 1. *Categorical* 1. *Logical* 1. *Empirical* ]] .pull-right[ .left[ **Four Effective Dimensions** 1. *Time* * Short-term * Medium-term * Long-term 1. *Space* * National * Regional * Global 1. *System Space Resolution* * Activity-level * Option-level * Mix-level 1. *Ambient Space Resolution* ]] --- name: global-1 class: center ### Carbon Emissions & Concentrations: **Global** .pull-left[  ] .pull-right[  ] .left[.footnote[<small>For more details explore the [dashoard]().</small>]] --- name: global-2 class: center ### Carbon Emissions & Concentrations: **Global** .pull-left[   ] .pull-right[   ] .left[.footnote[<small>For more details explore the [dashoard]().</small>]] --- name: regional-1 class: center ### Carbon Emissions & Concentrations: **Regional** .pull-left[   ] .pull-right[   ] .left[.footnote[<small>For more details explore the [dashoard]().</small>]] --- name: regional-2 class: center ### Carbon Emissions & Concentrations: **Regional** .pull-left[   ] .pull-right[   ] .left[.footnote[<small>For more details explore the [dashoard]().</small>]] --- name: regional-3 class: center ### Carbon Emissions & Concentrations: **Regional** .pull-left[   ] .pull-right[   ] .left[.footnote[<small>For more details explore the [dashoard]().</small>]] --- name: national-1 class: center ### Carbon Emissions & Energy Use: **National** .pull-left[   ] .pull-right[   ] .left[.footnote[<small>For more details explore the [dashoard]().</small>]] --- name: wri class: center <iframe src='https://public.flourish.studio/visualisation/1124101/embed' frameborder='0' scrolling='no' style='width:100%;height:570px;'></iframe> .left[.footnote[<small>For more details explore the [dashoard]().</small>]] --- name: historical-rates class: center ### Deployment, Decarbonization & Decoupling .pull-left[ 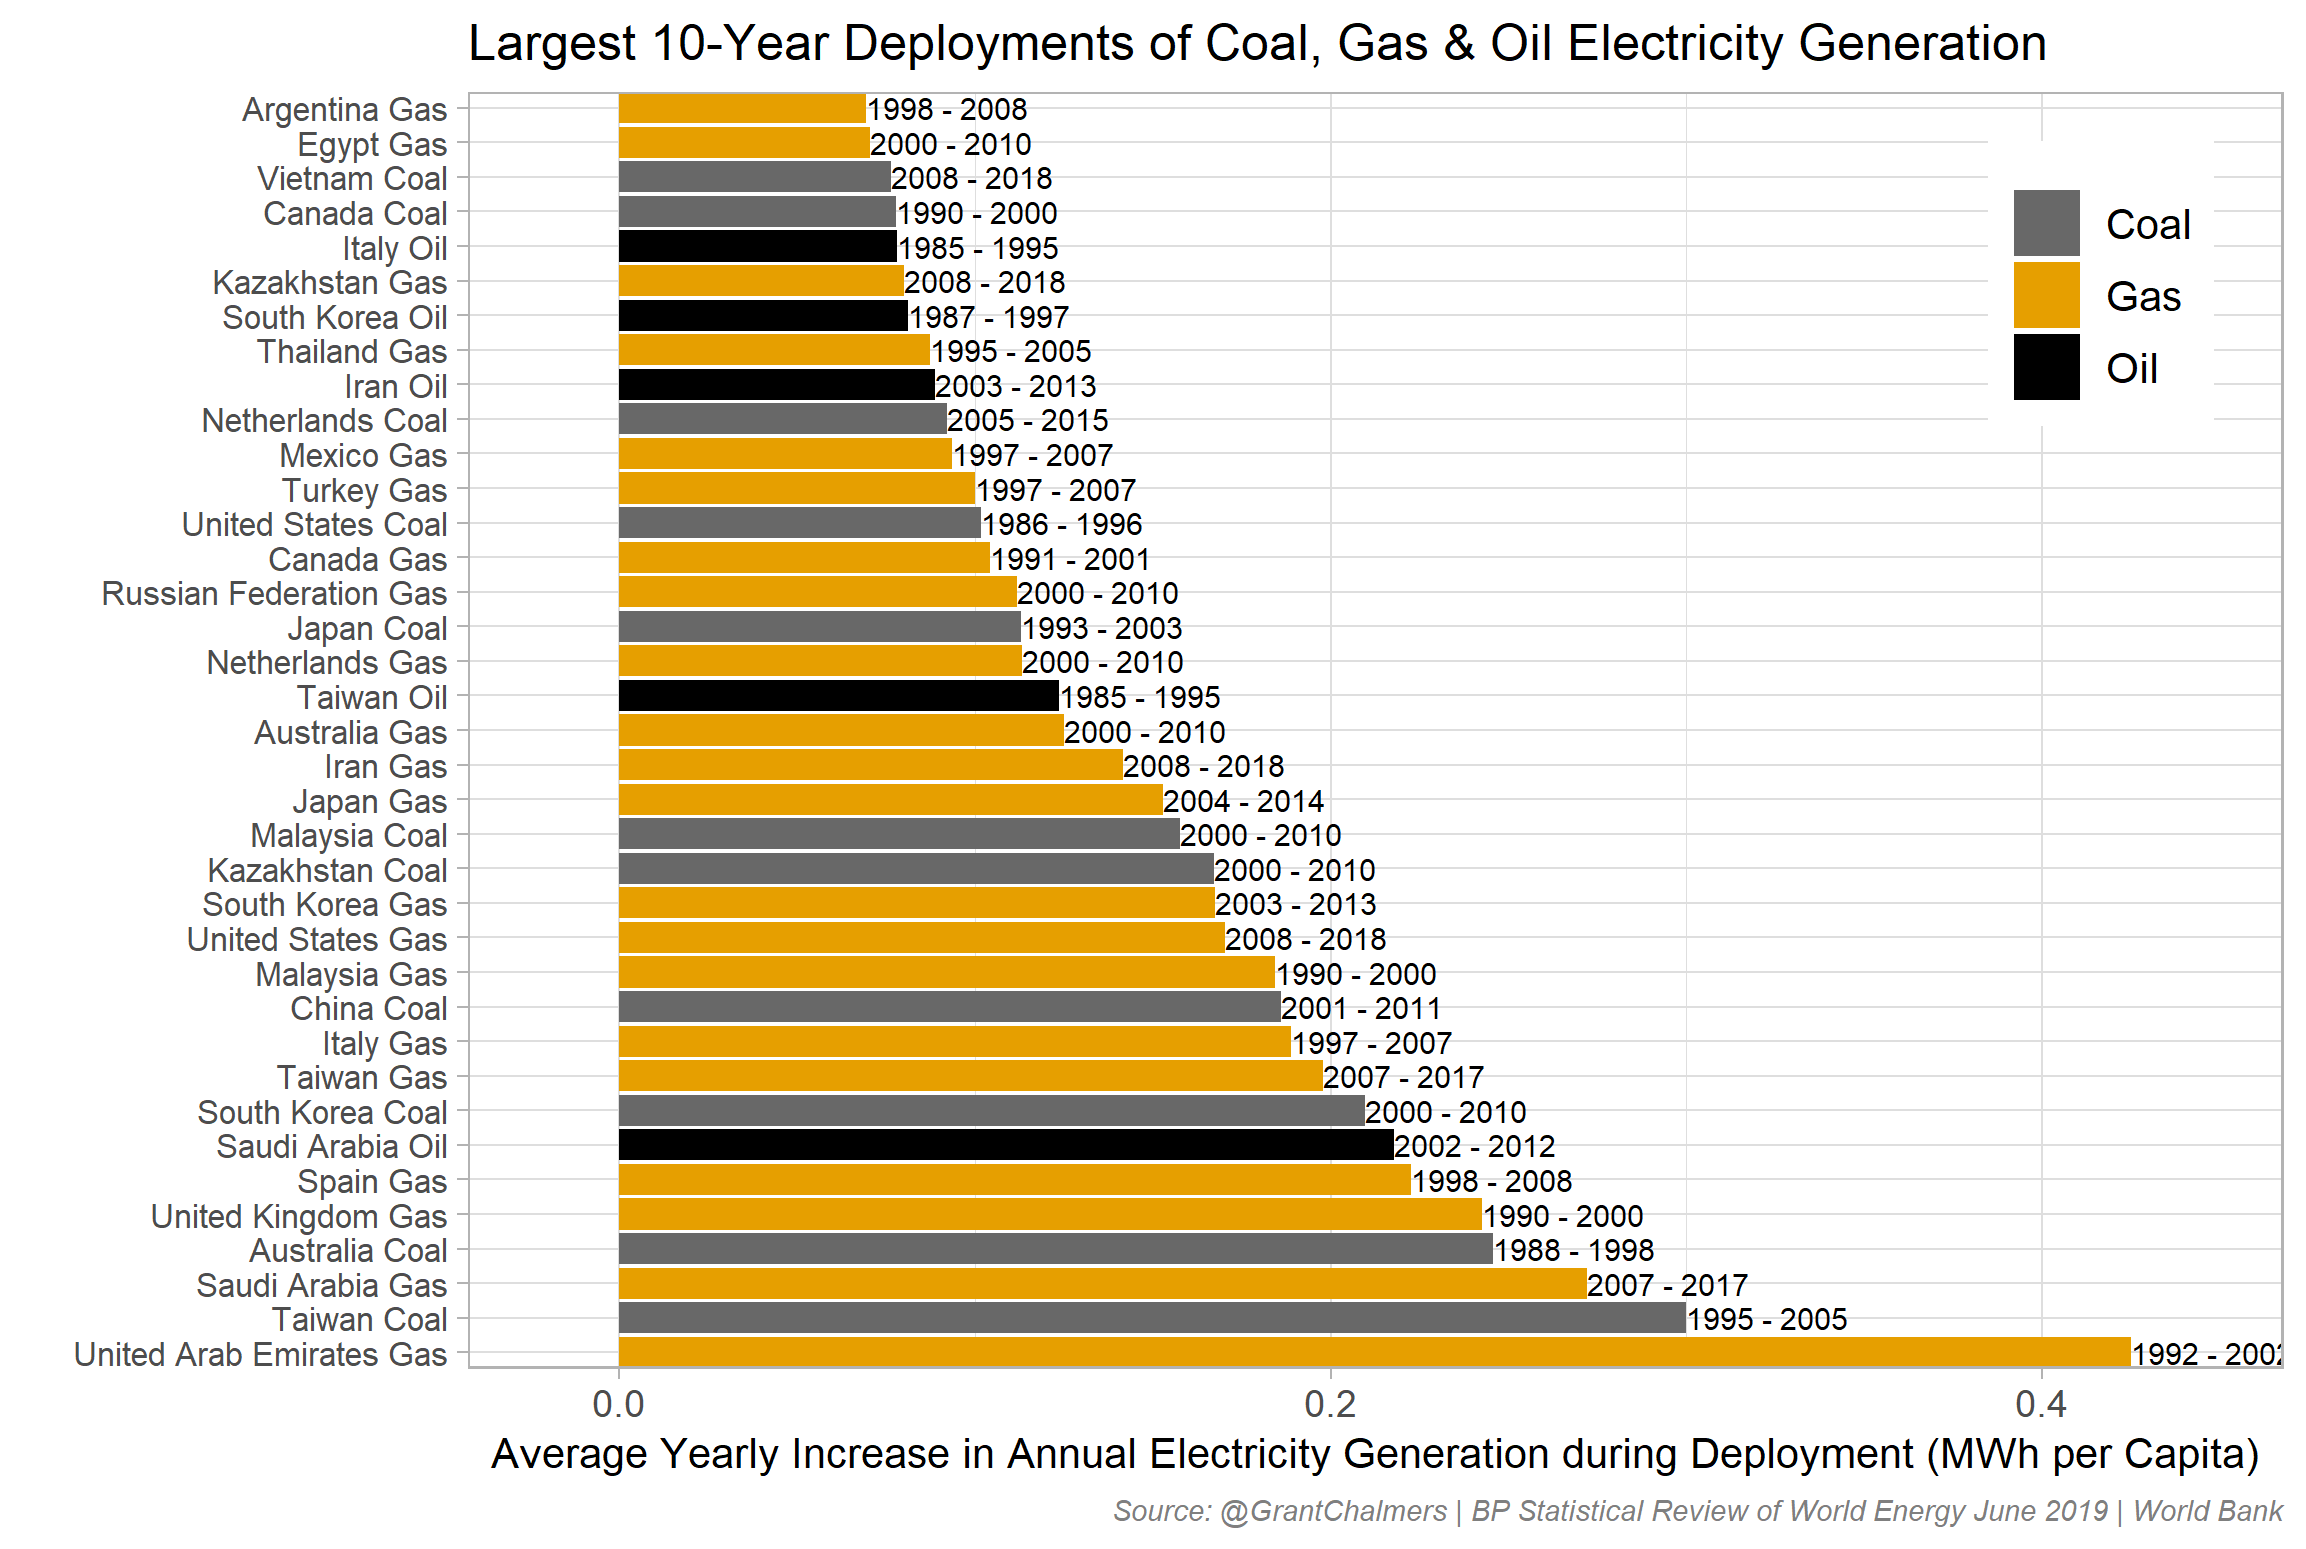 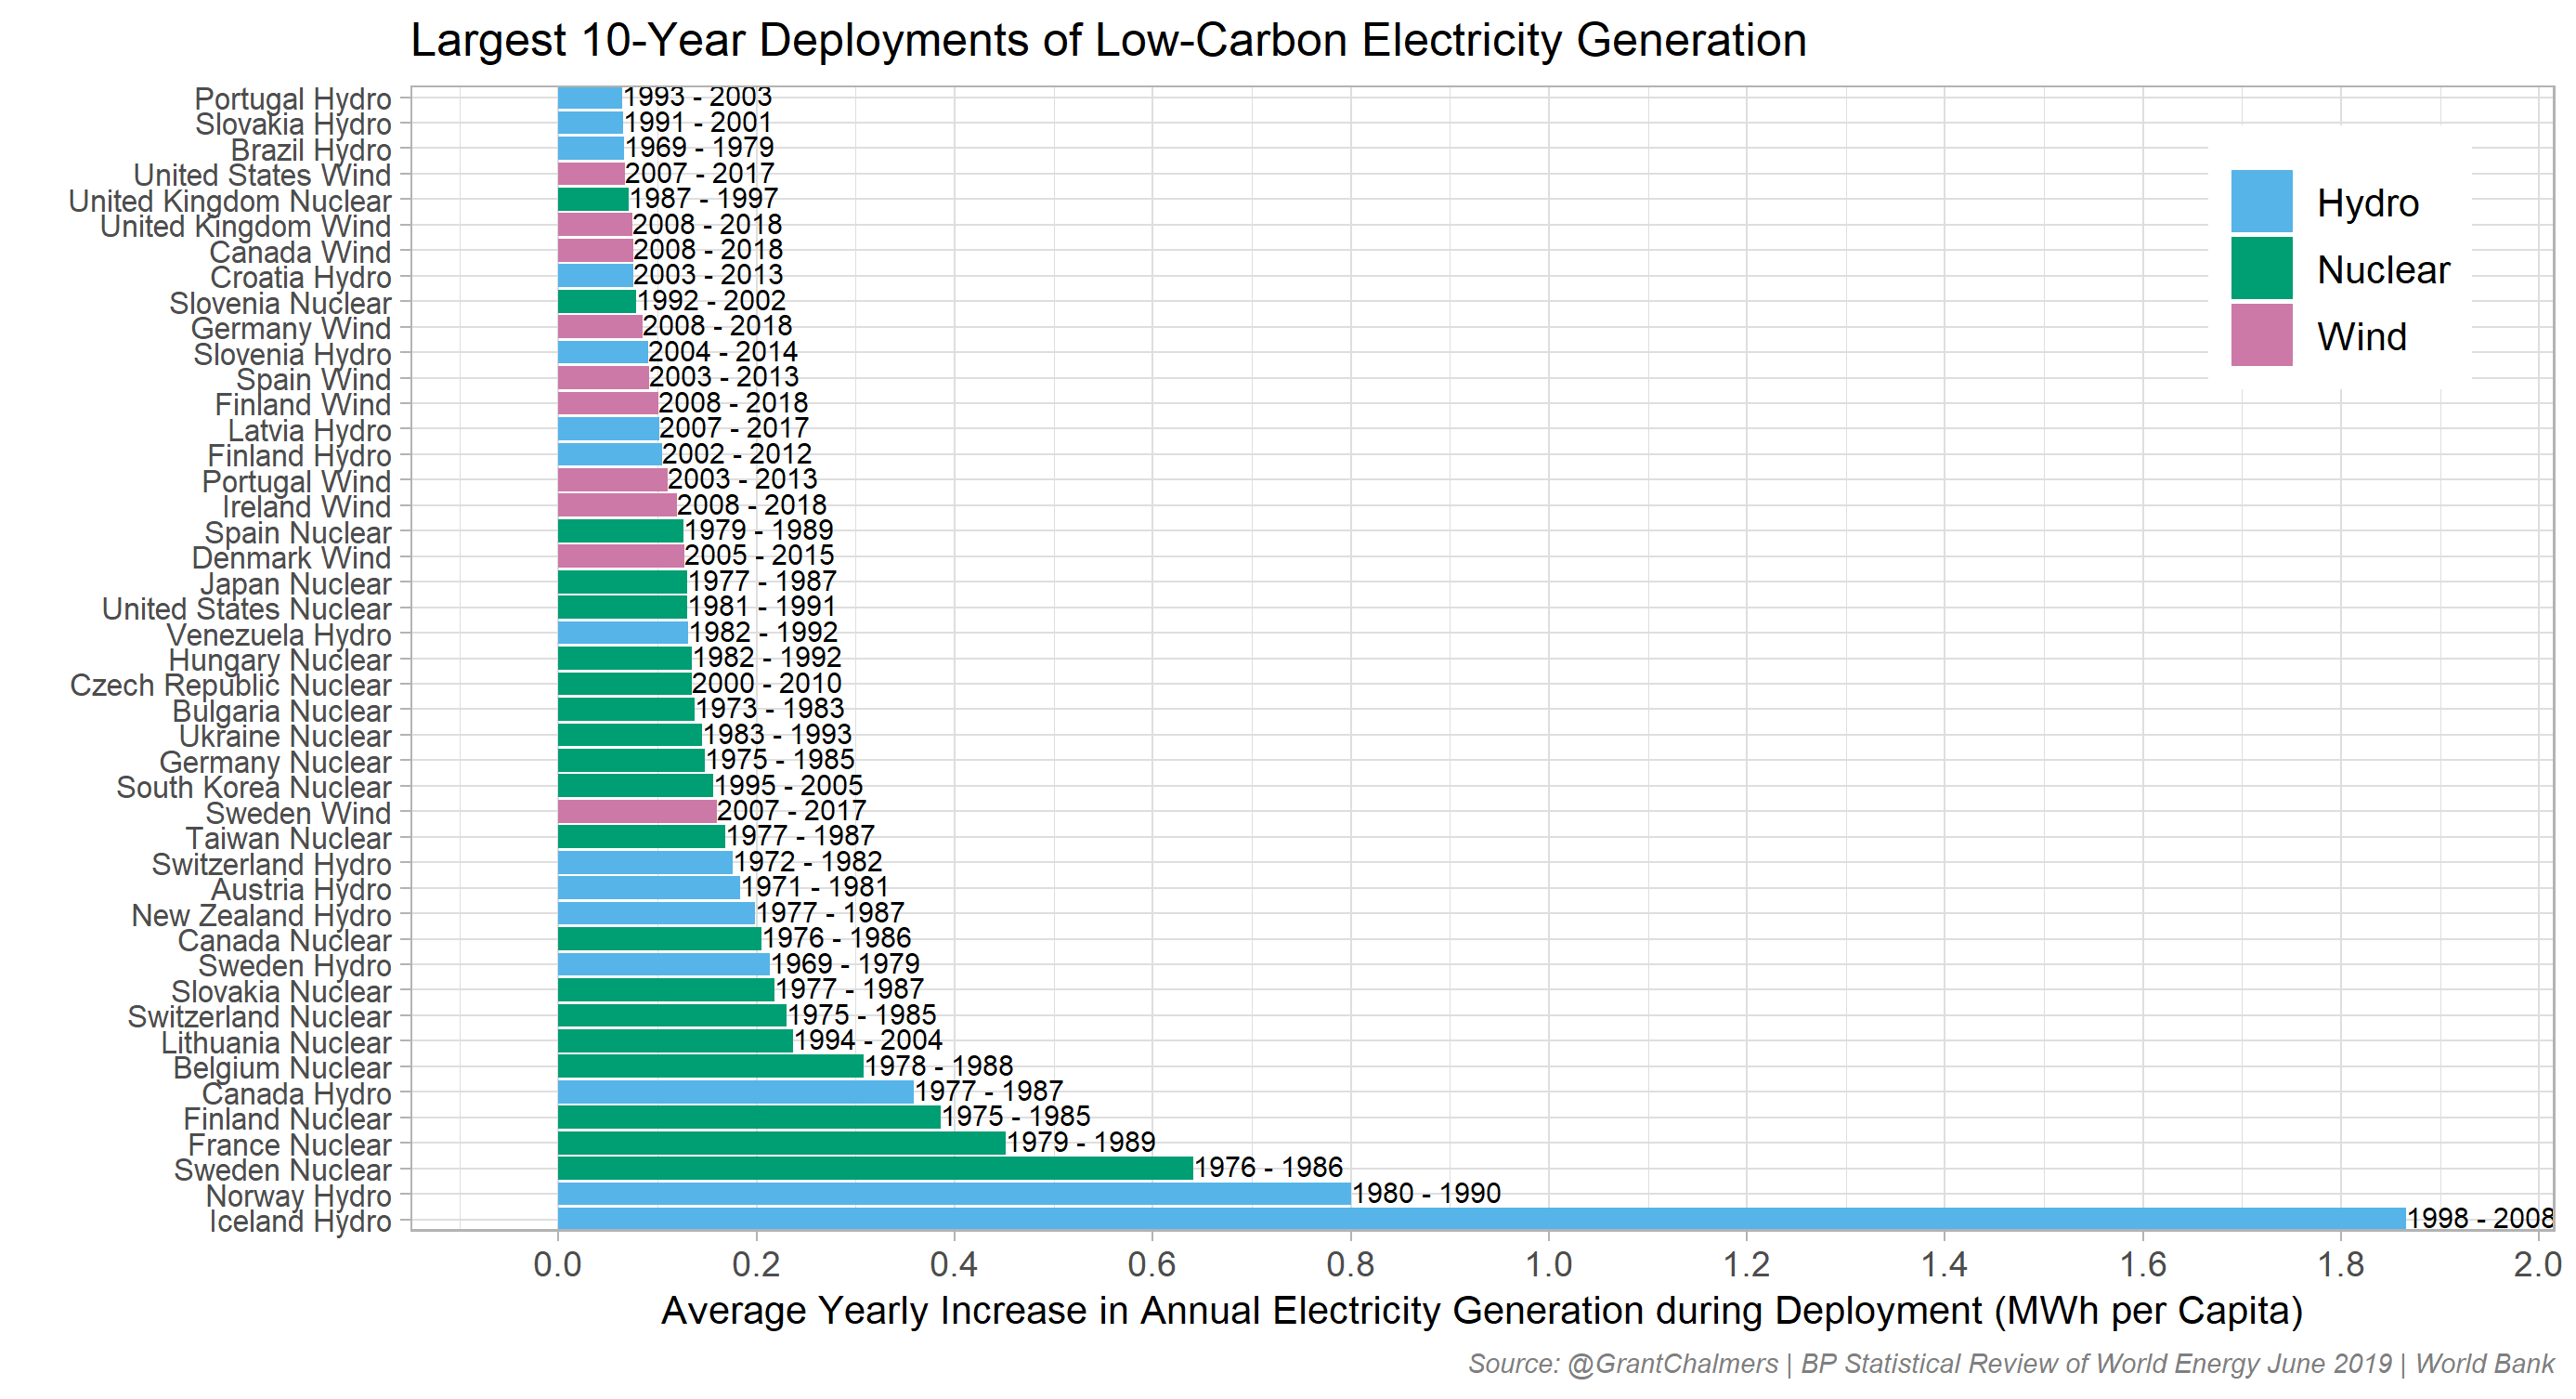 .left[.footnote[<small>**Source**: [Grant Chalmers](https://twitter.com/GrantChalmers)</small>]] ] .pull-right[ <iframe src="https://ourworldindata.org/grapher/co2-emissions-and-gdp?country=ITA" style="width: 100%; height: 550px; border: 0px none;"></iframe> ] --- name: decarbonization-commandments class: center background-image: url(https://media.springernature.com/full/springer-static/image/art%3A10.1038%2Fngeo2826/MediaObjects/41561_2016_Article_BFngeo2826_Fig2_HTML.jpg) background-position: center background-size: contain ### Decarbonization: **The Three Commandments** .left[.footnote[<small>**Source**: [Sachs et al. (2016)](https://www.nature.com/articles/ngeo2826)</small>]] --- class: center background-image: url("figures/jesse-jenkins/low-carbon-toolbox.png") background-position: center background-size: contain ### The Low-Carbon Toolbox .left[.footnote[<small>**Source**: [Jesse Jenkins](https://www.dropbox.com/s/gwyn0ve9czwu3hb/01%20-%20Intro%20to%20course.pdf?dl=0)</small>]] --- name: electricity-map class: center ### EU Electricity Consumption: **Carbon Intensity** <iframe width="800" height="480" src="https://www.youtube.com/embed/rKYhPAMDI-w" frameborder="0" allow="accelerometer; autoplay; encrypted-media; gyroscope; picture-in-picture" allowfullscreen></iframe> .left[<small>**Source**: [electricityMap](https://www.electricitymap.org/?page=map&solar=false&remote=true&wind=false)</small>] --- name: eu-mix class: center ### EU Production Mix <iframe src="https://ourworldindata.org/grapher/world-electricity-by-source?country=European%20Union" style="width: 100%; height: 500px; border: 0px none;"></iframe> .left[.footnote[<small>For more details explore the [dashoard]().</small>]] --- name: eu-lowcarbon class: center ### EU Low-Carbon Mix 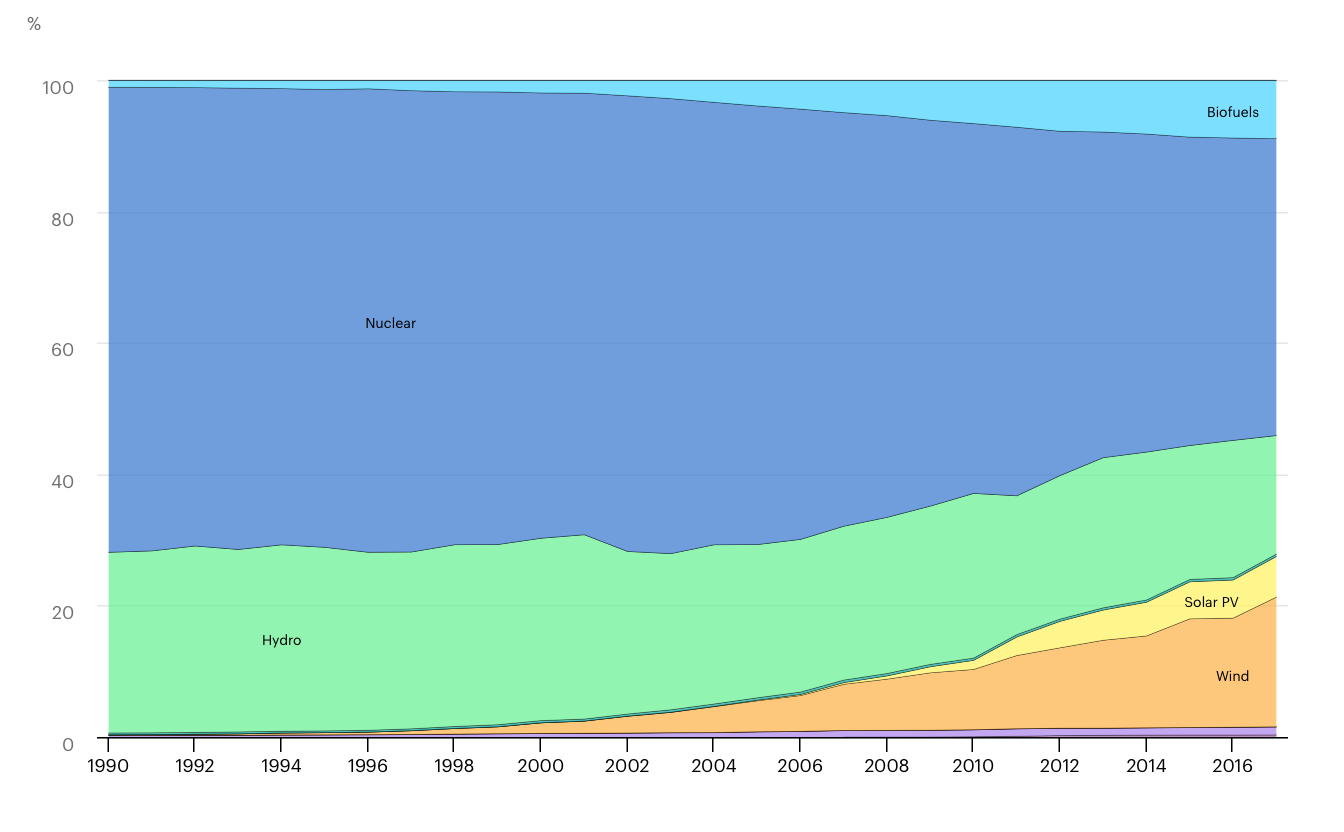 .left[.footnote[**Source**: [IEA](https://www.iea.org/subscribe-to-data-services/electricity-statistics)]] --- name: carbon-intensity class: center ### EU Carbon Intensity (2019) 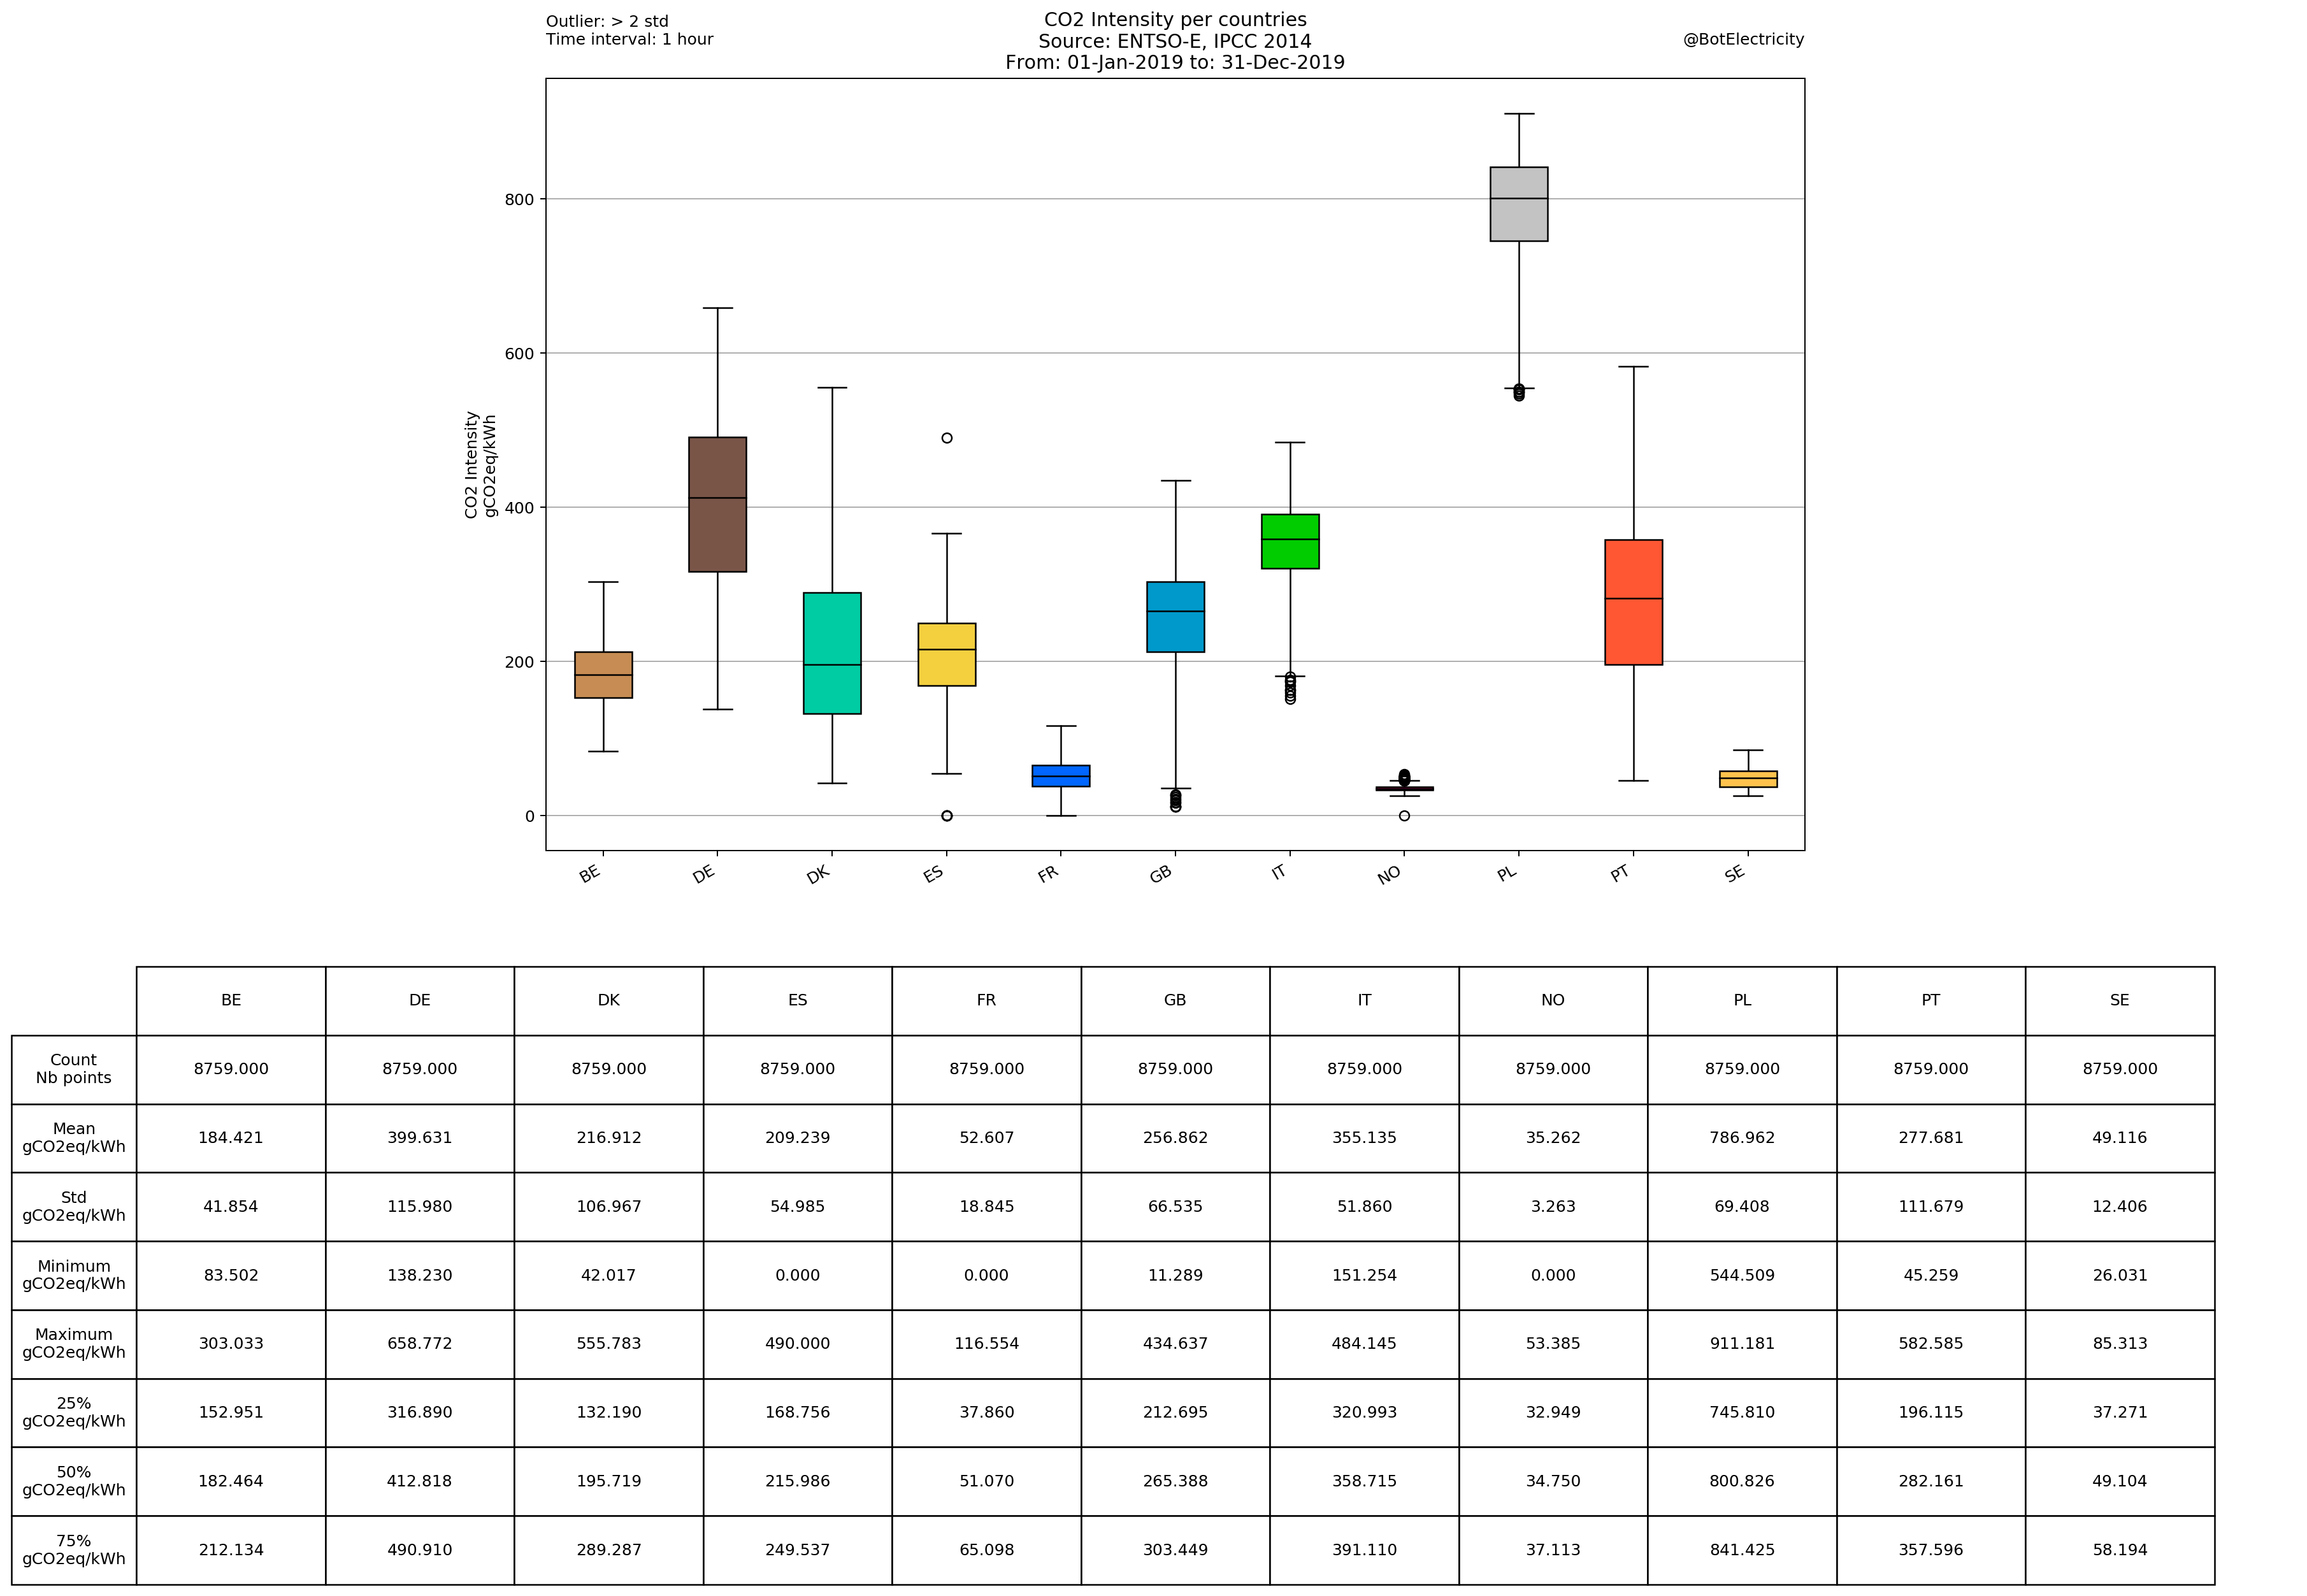 .left[<small>**Sources**: [IPCC AR5 (2014)](https://www.ipcc.ch/report/ar5/wg3/energy-systems/) | [ENTSO-E (2019)](https://www.entsoe.eu/data/)</small>] --- name: carbon-intensity-power class: center ### Carbon Intensity vs. Power Generation (2019)  .left[<small>**Sources**: [IPCC AR5 (2014)](https://www.ipcc.ch/report/ar5/wg3/energy-systems/) | [ENTSO-E (2019)](https://www.entsoe.eu/data/)</small>] --- name: needs-project class: center background-image: url(figures/papers/psi/framework1.png) background-position: center background-size: contain ### The Multiplexity of Sustainability .left[.footnote[<small>**Sources**: [EU NEEDS Project (2009)](http://www.needs-project.org) | [Hirschberg et al. (2015)](https://doi.org/10.1002/9781118991978.hces070) </small>]] --- name: sustainability-environmental class: center ### Sustainability Dimensions: **Environmental** 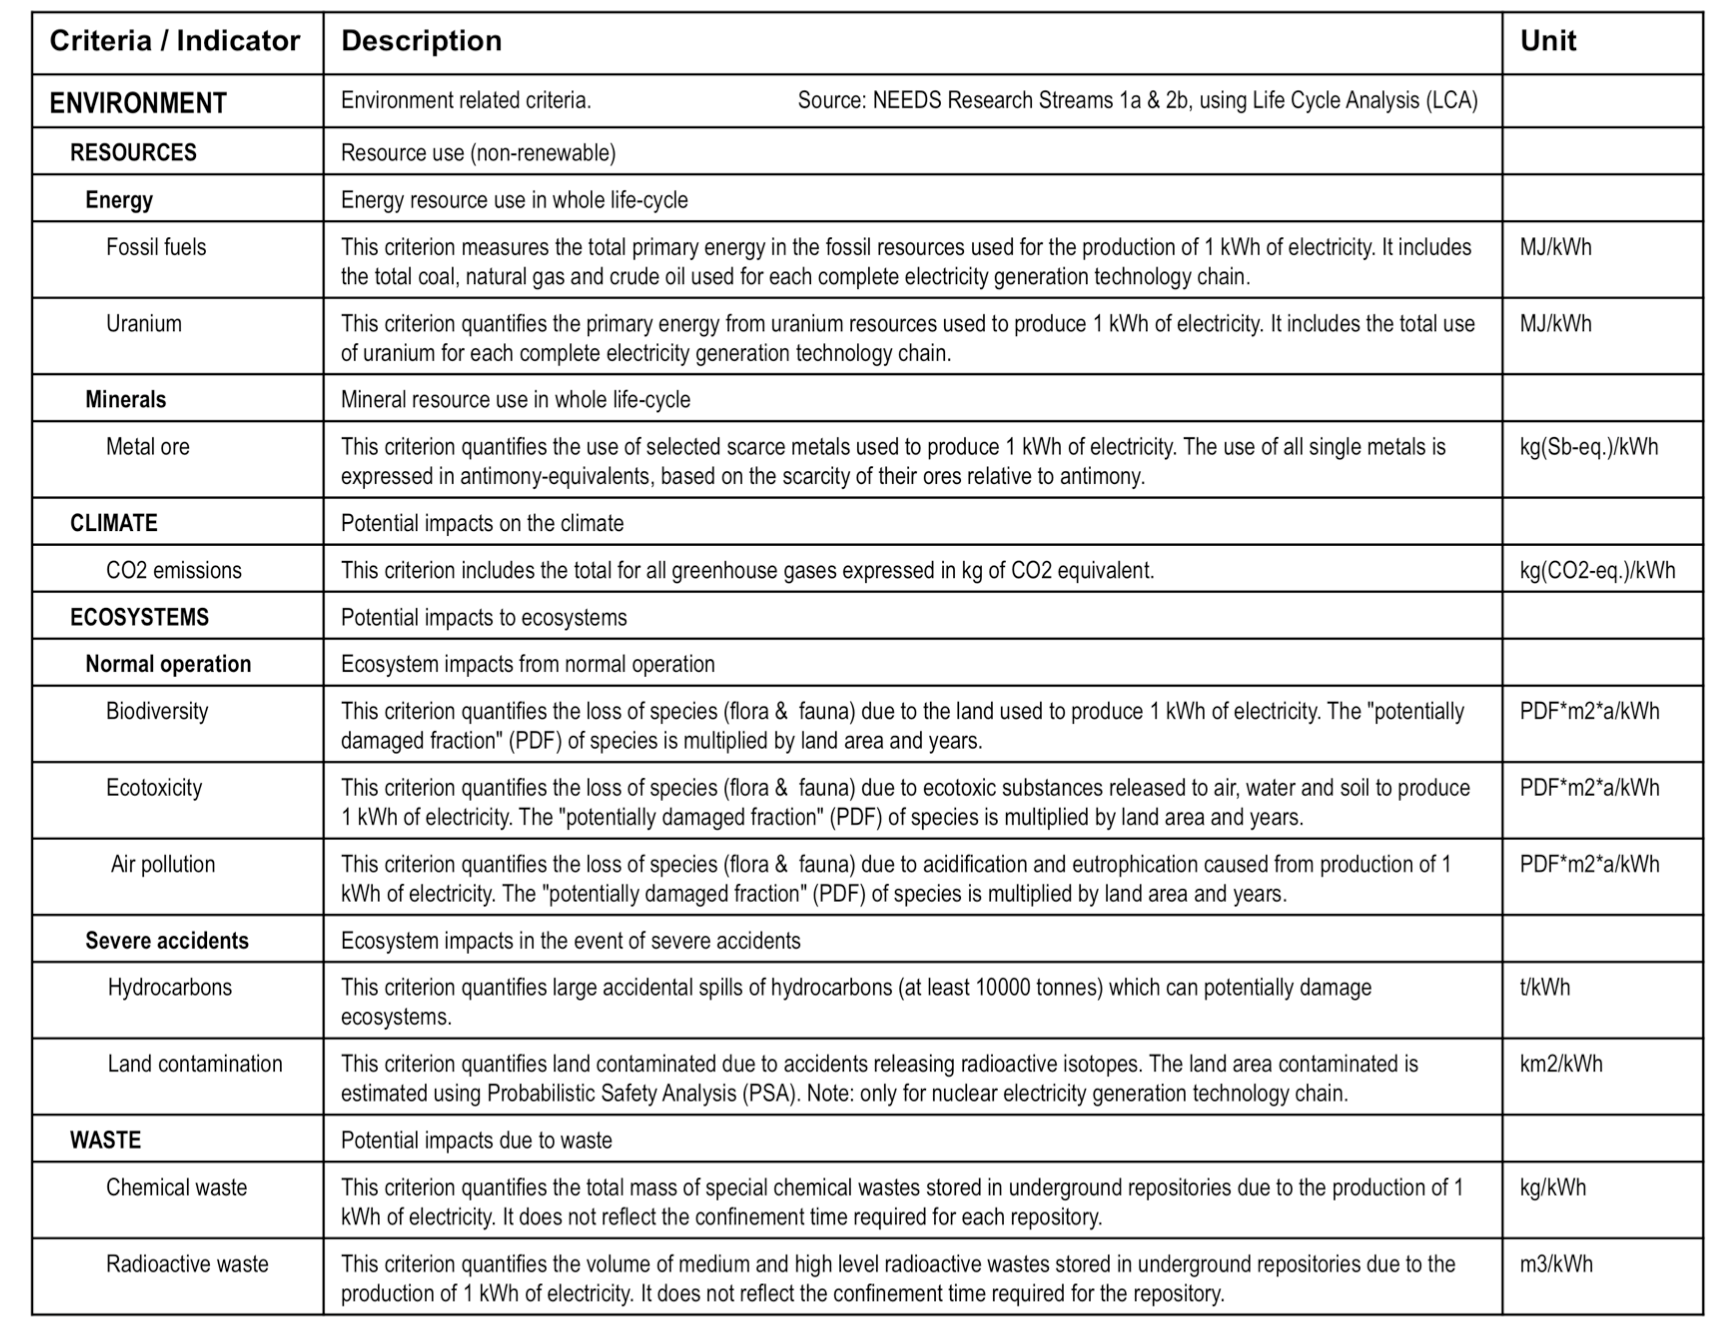 --- name: data-environmental class: center ### Option-Level Environmental Impacts .pull-left[ 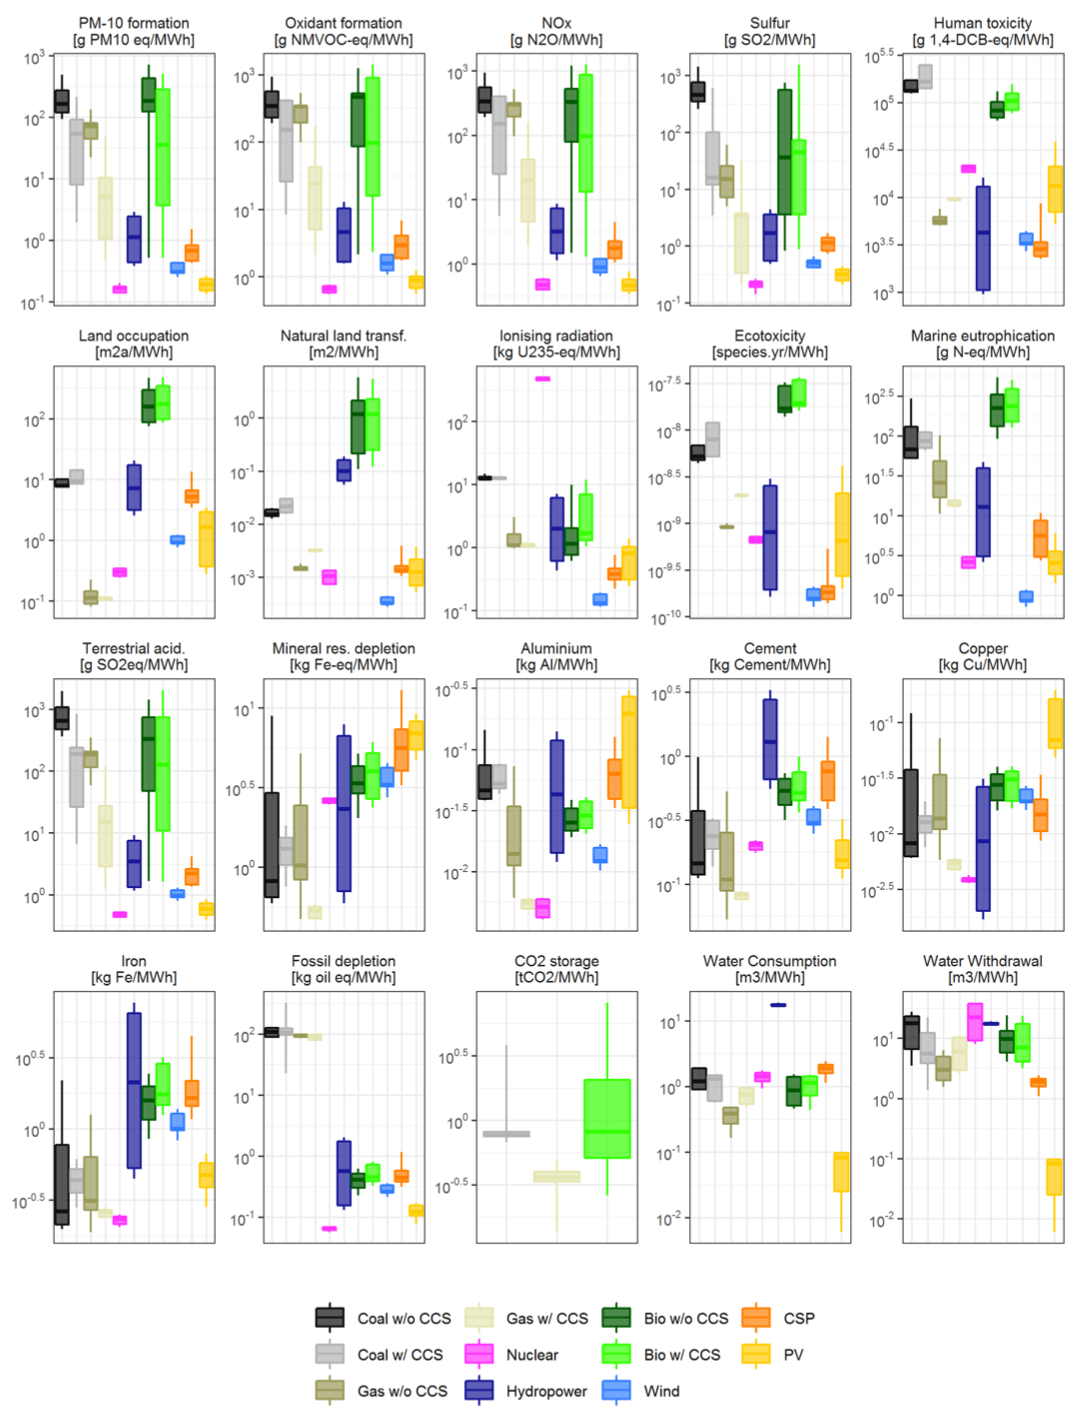 .left[.footnote[<small>**Source**: [Luderer et al. (2019)](https://www.nature.com/articles/s41467-019-13067-8)</small>]] ] .pull-right[  .left[.footnote[<small>**Source**: [Gibon et al. (2017)](https://www.sciencedirect.com/science/article/abs/pii/S1364032117304215?via%3Dihub)</small>]] ] --- name: data-environmental class: center background-image: url(figures/papers/r&s/fig2.png) background-position: center background-size: contain ### Option-Level Env. Impacts: **Carbon Intensity** .left[.footnote[<small>**Source**: [Gibon et al. (2017)](https://www.sciencedirect.com/science/article/abs/pii/S1364032117304215?via%3Dihub)</small>]] --- name: data-environmental class: center ### Mix-Level Environmental Impacts 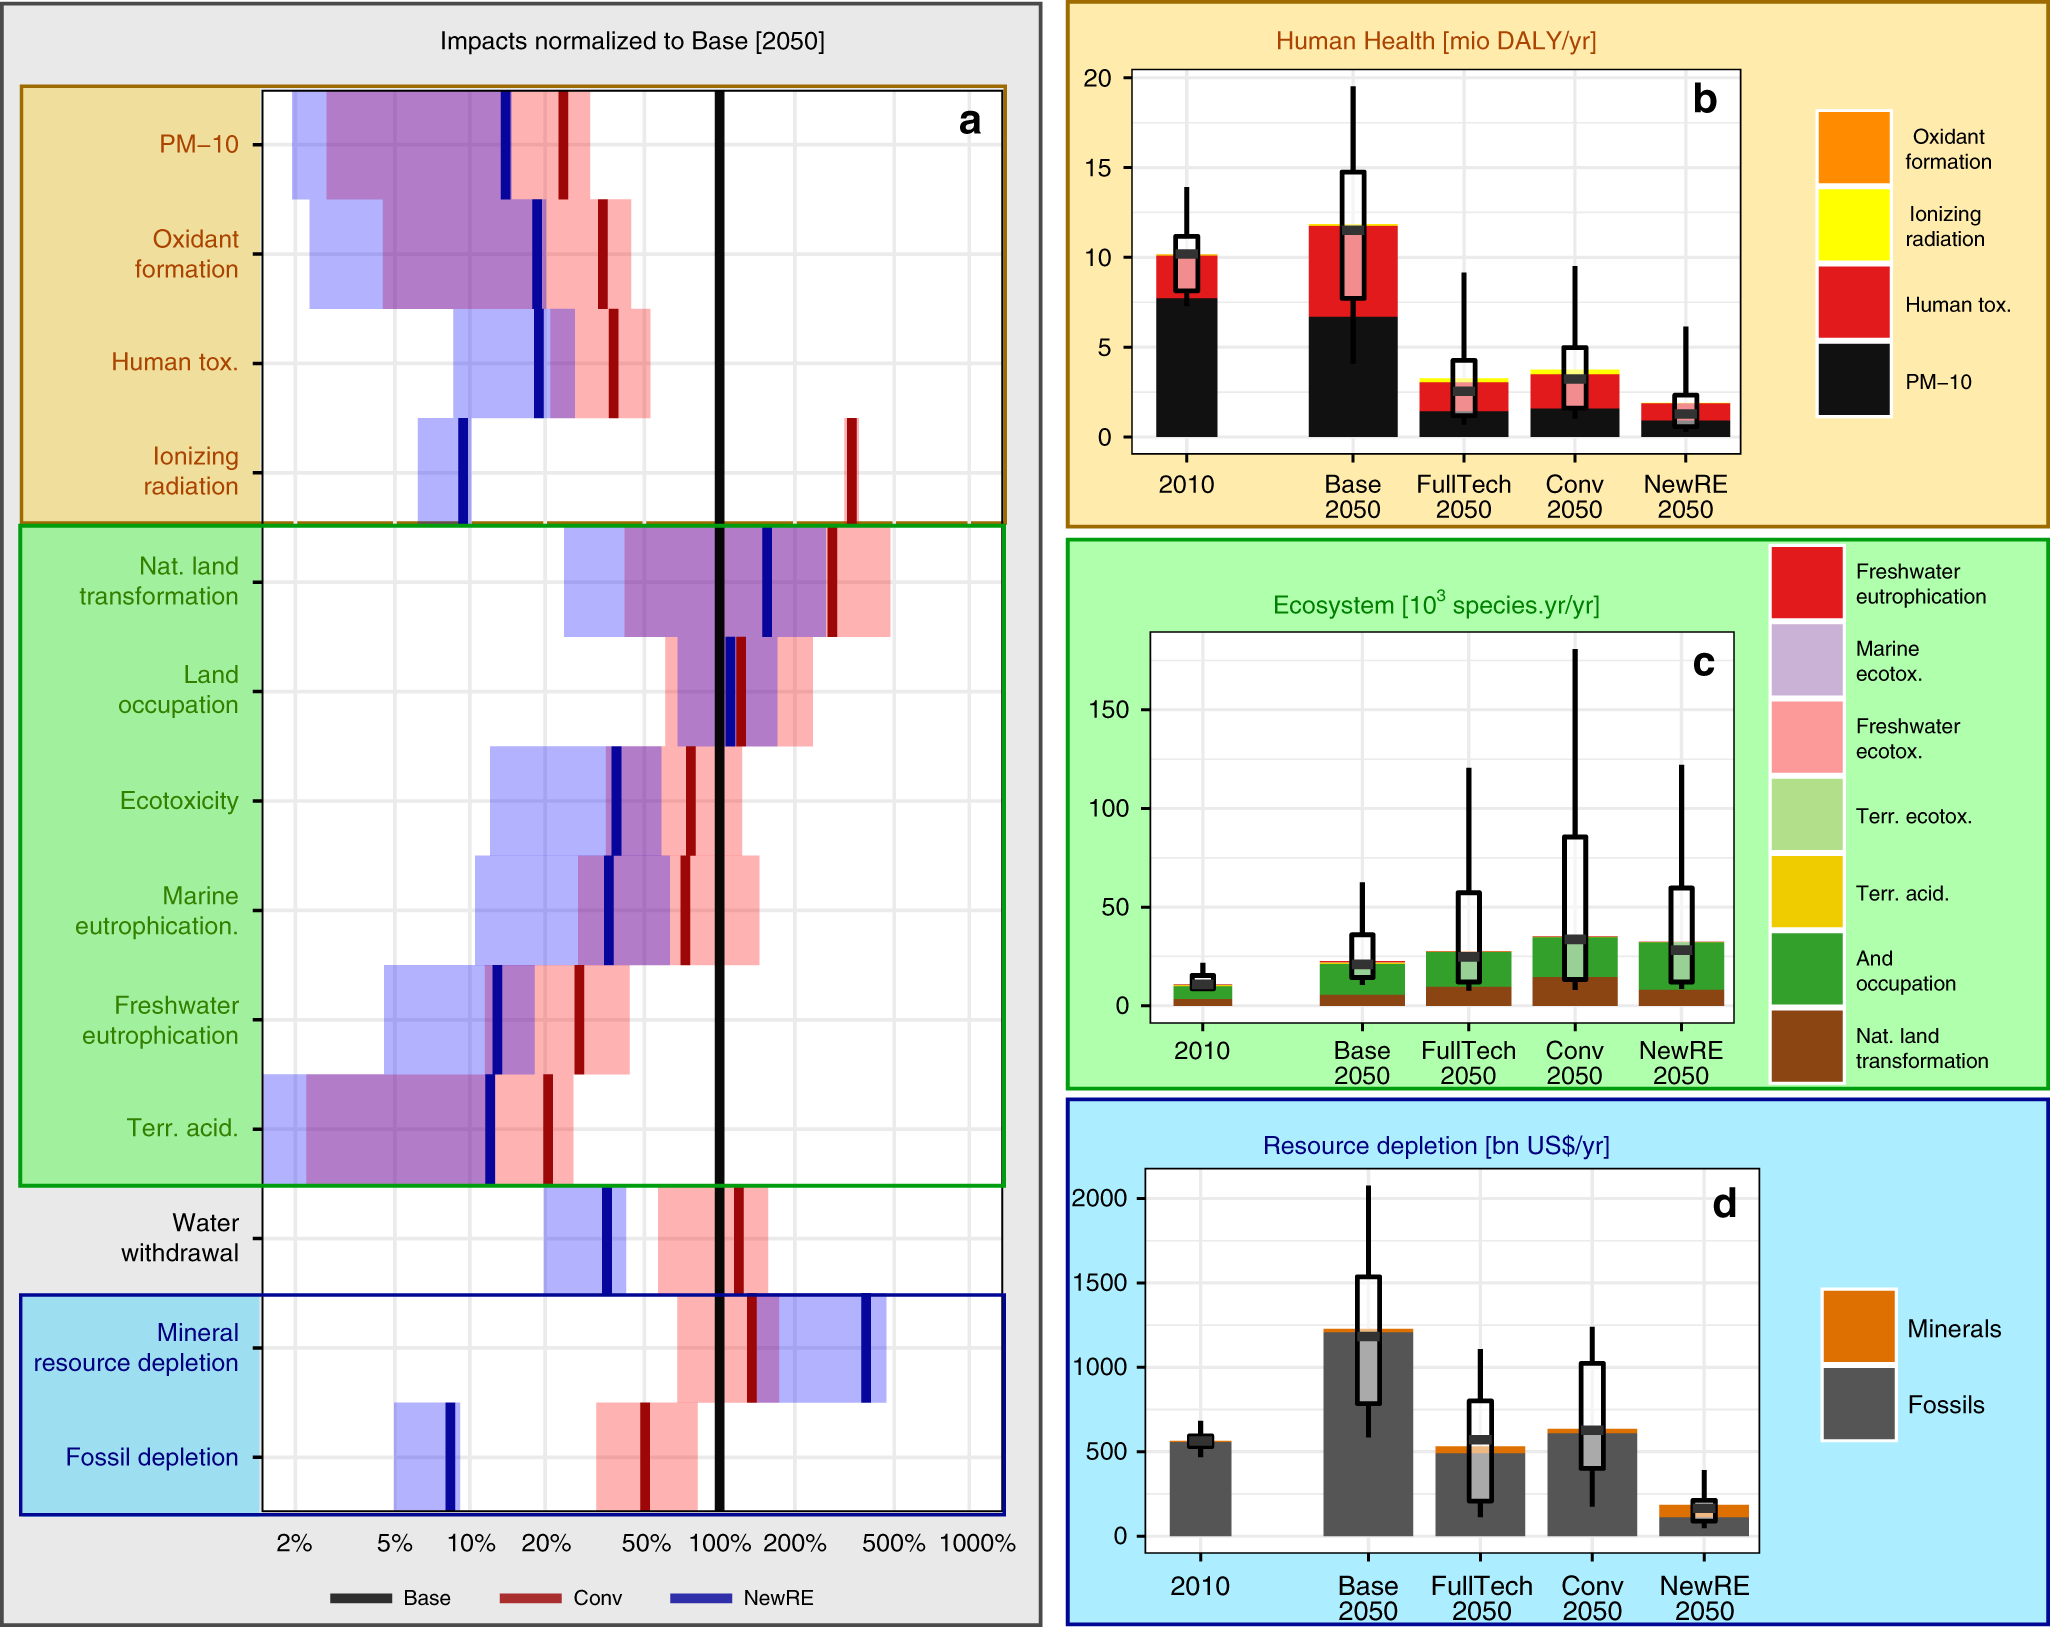 --- name: sustainability-economic class: center ### Sustainability Dimensions: **Economic** 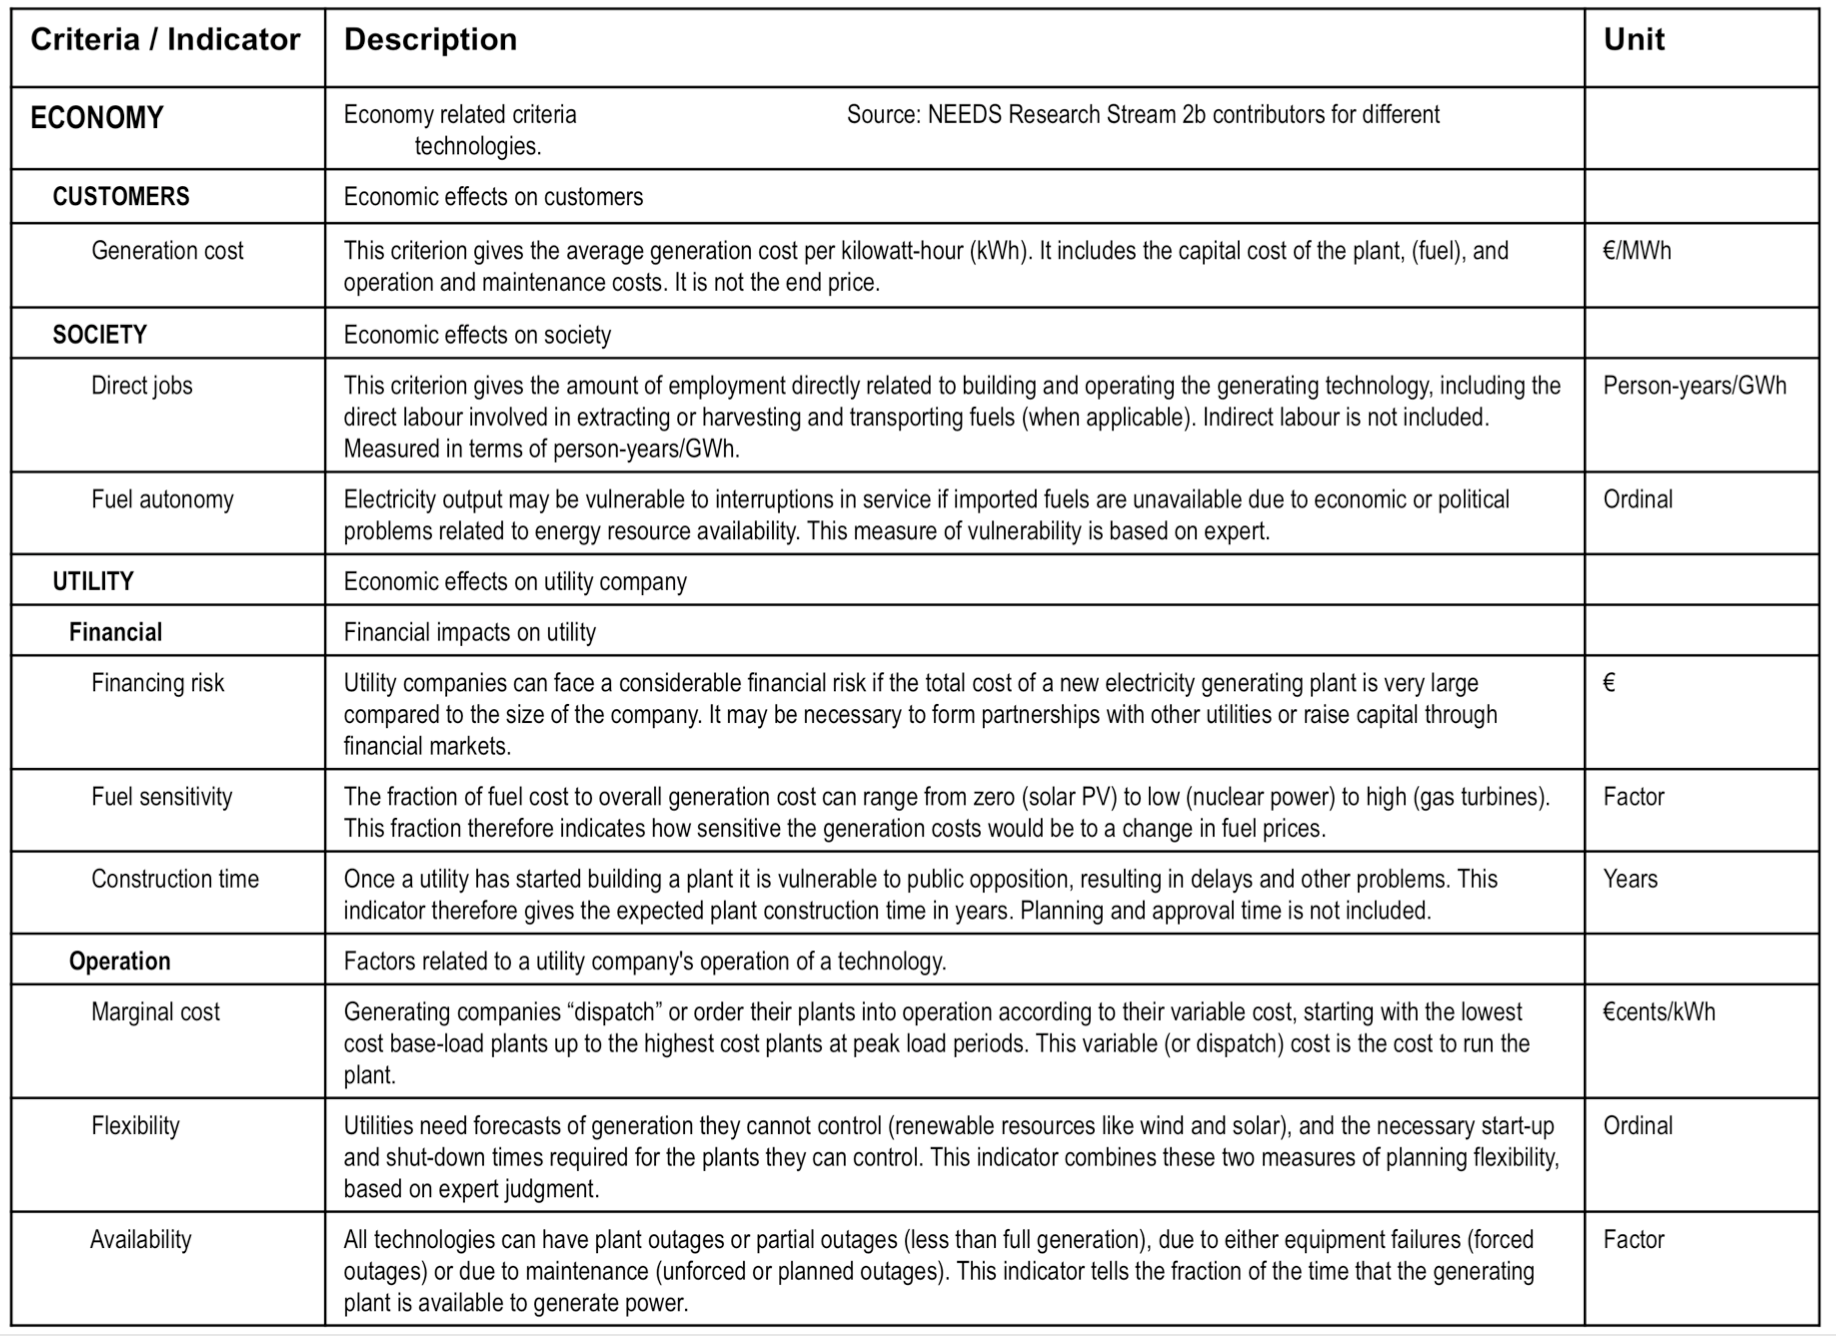 --- name: data-economic class: center ### Sustainability Dimensions: **Economic** .pull-left[ 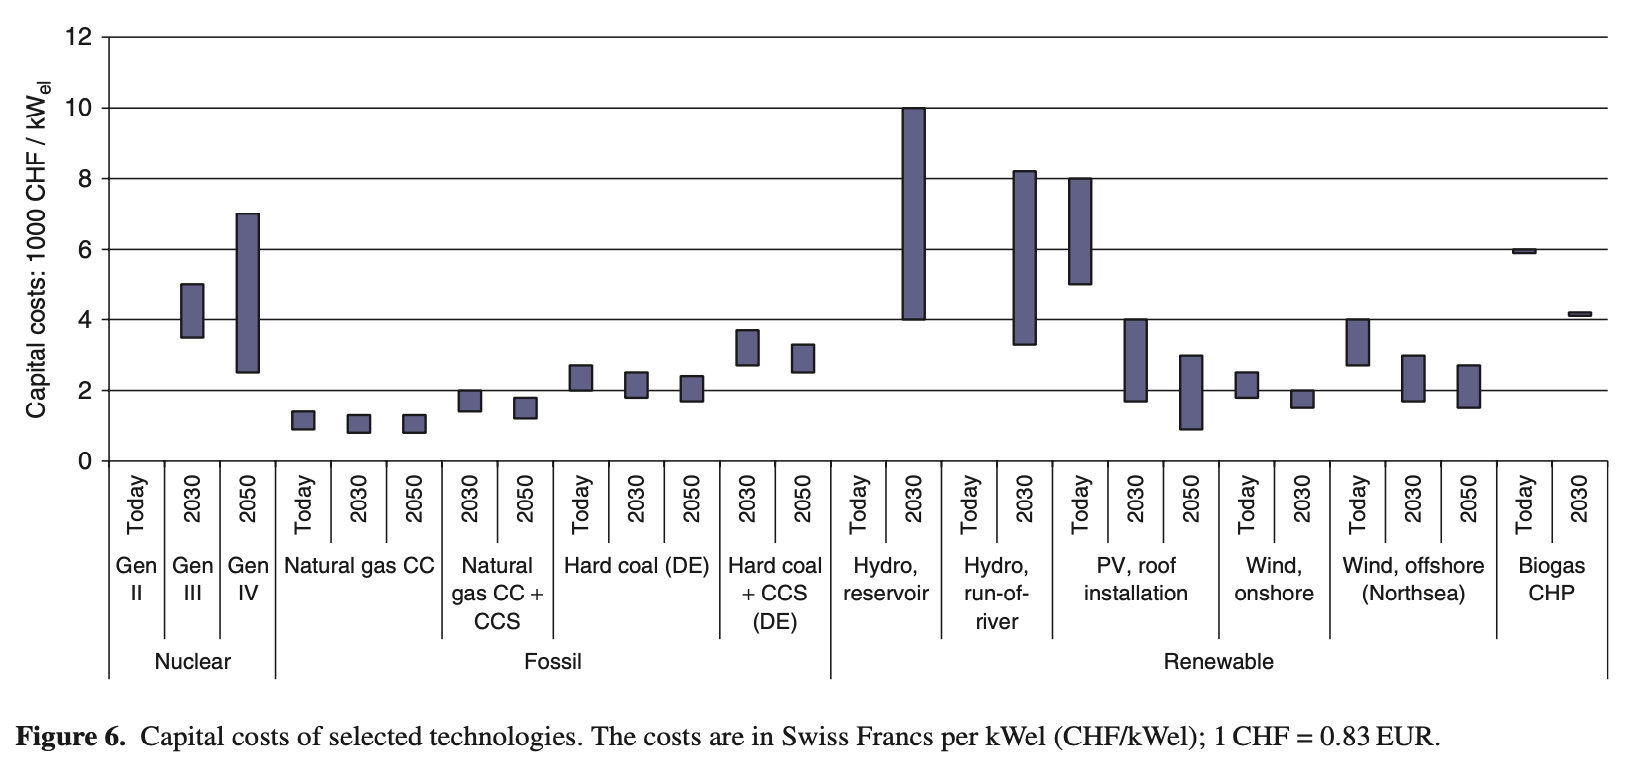 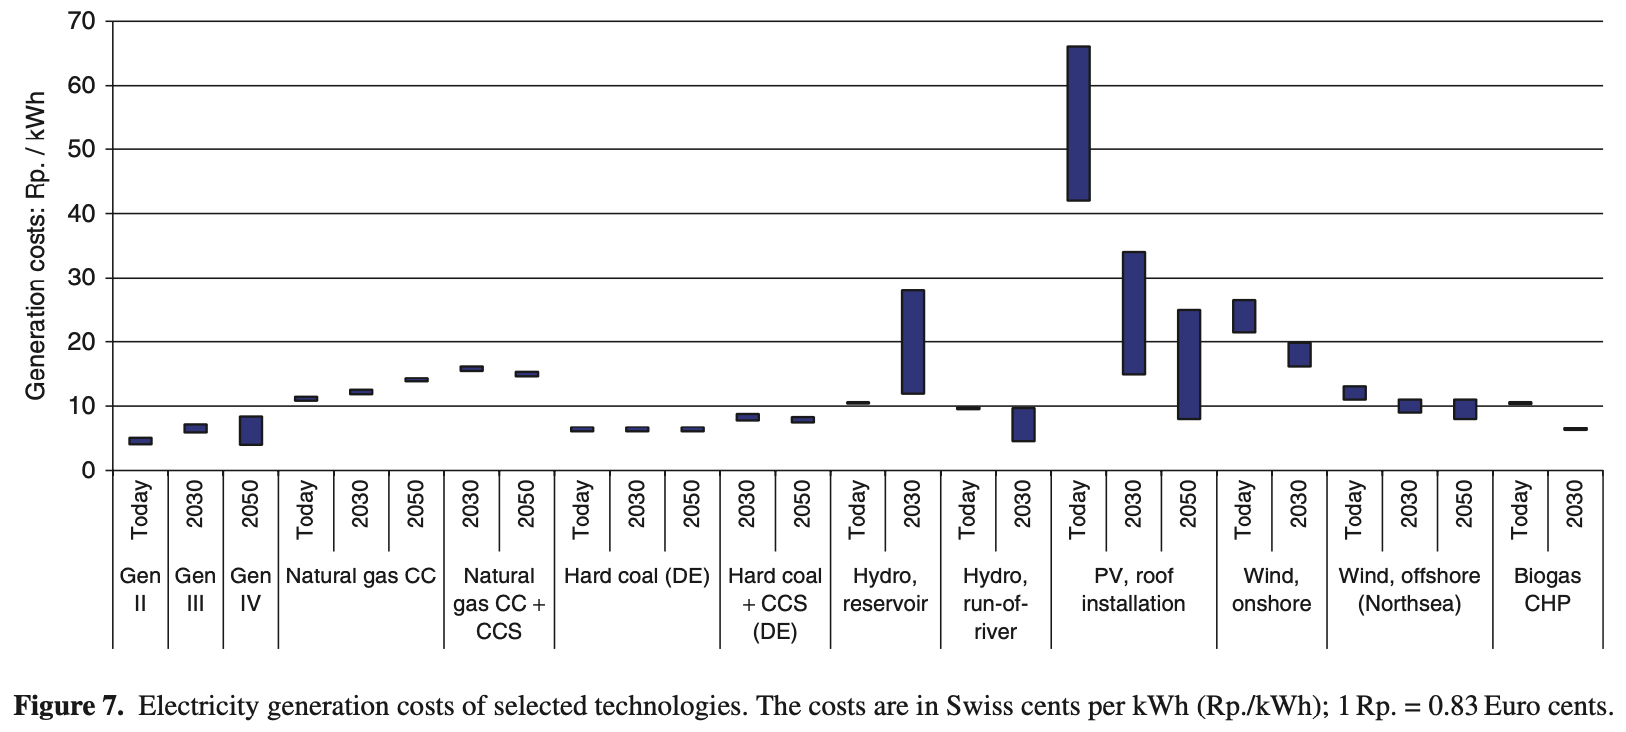 .left[.footnote[<small>**Sources**: [Hirschberg et al. (2015)](https://doi.org/10.1002/9781118991978.hces070)</small>]] ] .pull-right[   .left[.footnote[<small>**Source**: [Samadi (2017)](https://www.mdpi.com/1996-1073/10/3/356#)</small>]] ] --- name: sustainability-social class: center ### Sustainability Dimensions: **Social** 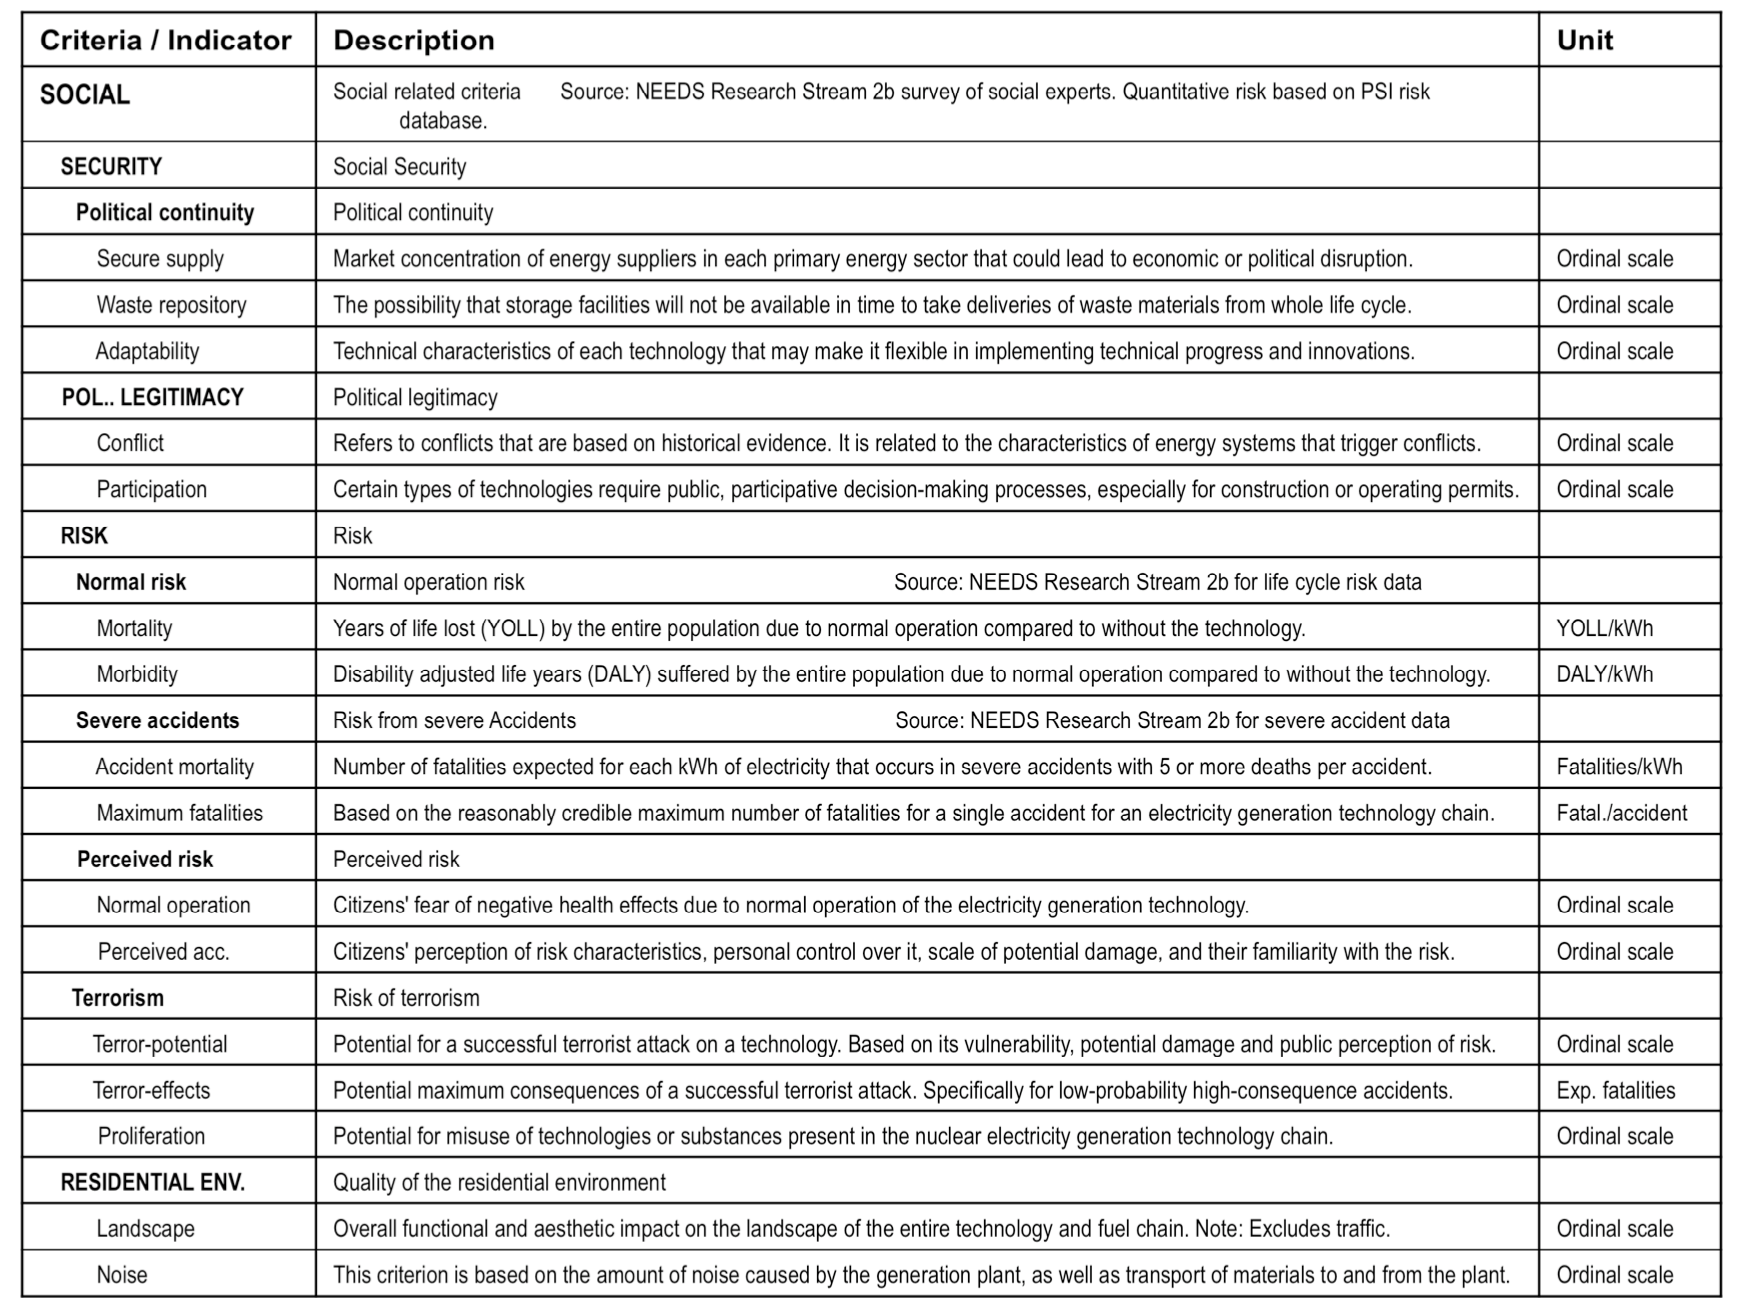 --- name: data-social class: center ### Sustainability Dimensions: **Social** .pull-left[ 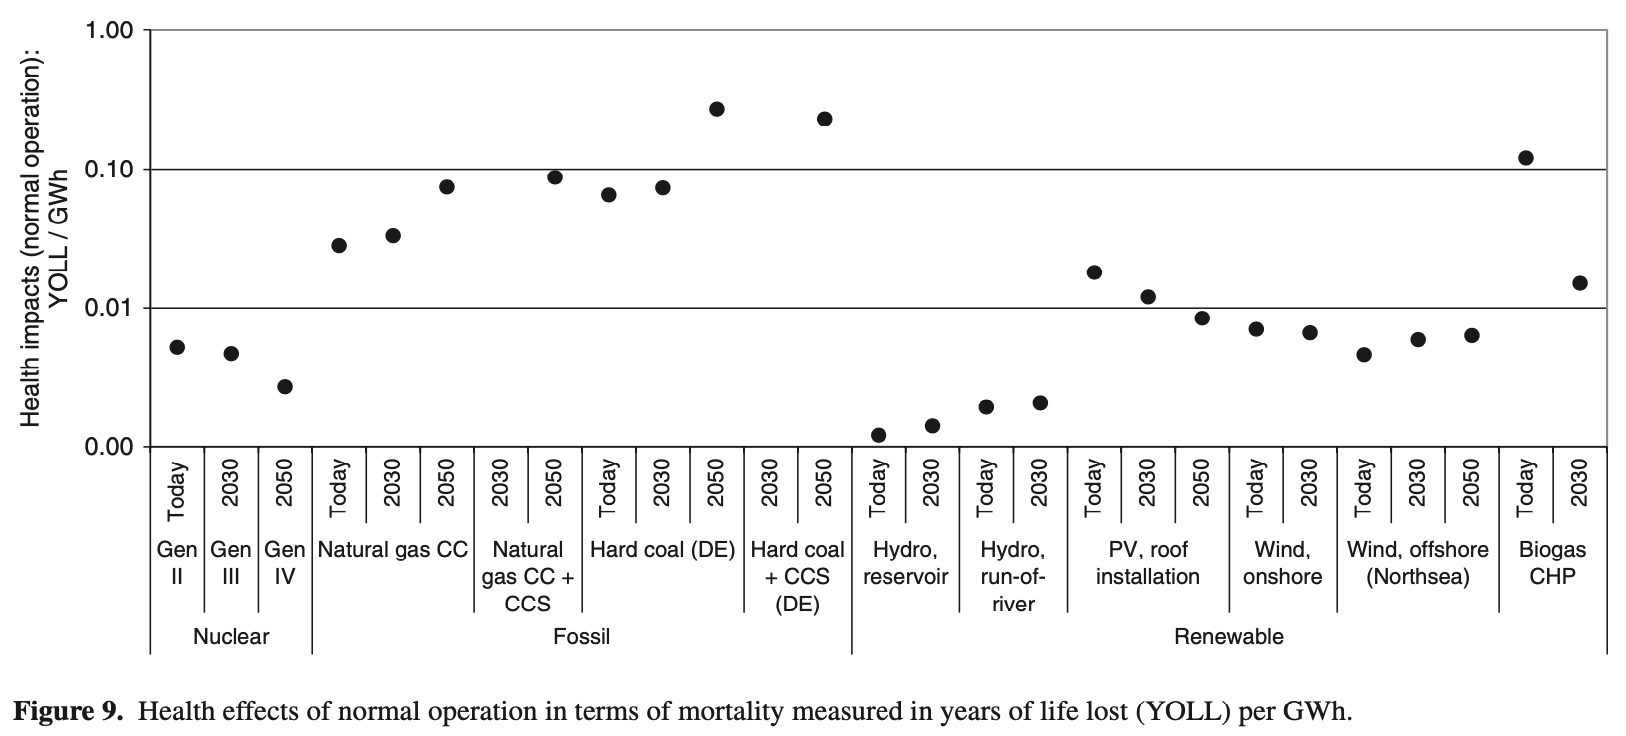  ] .pull-right[ 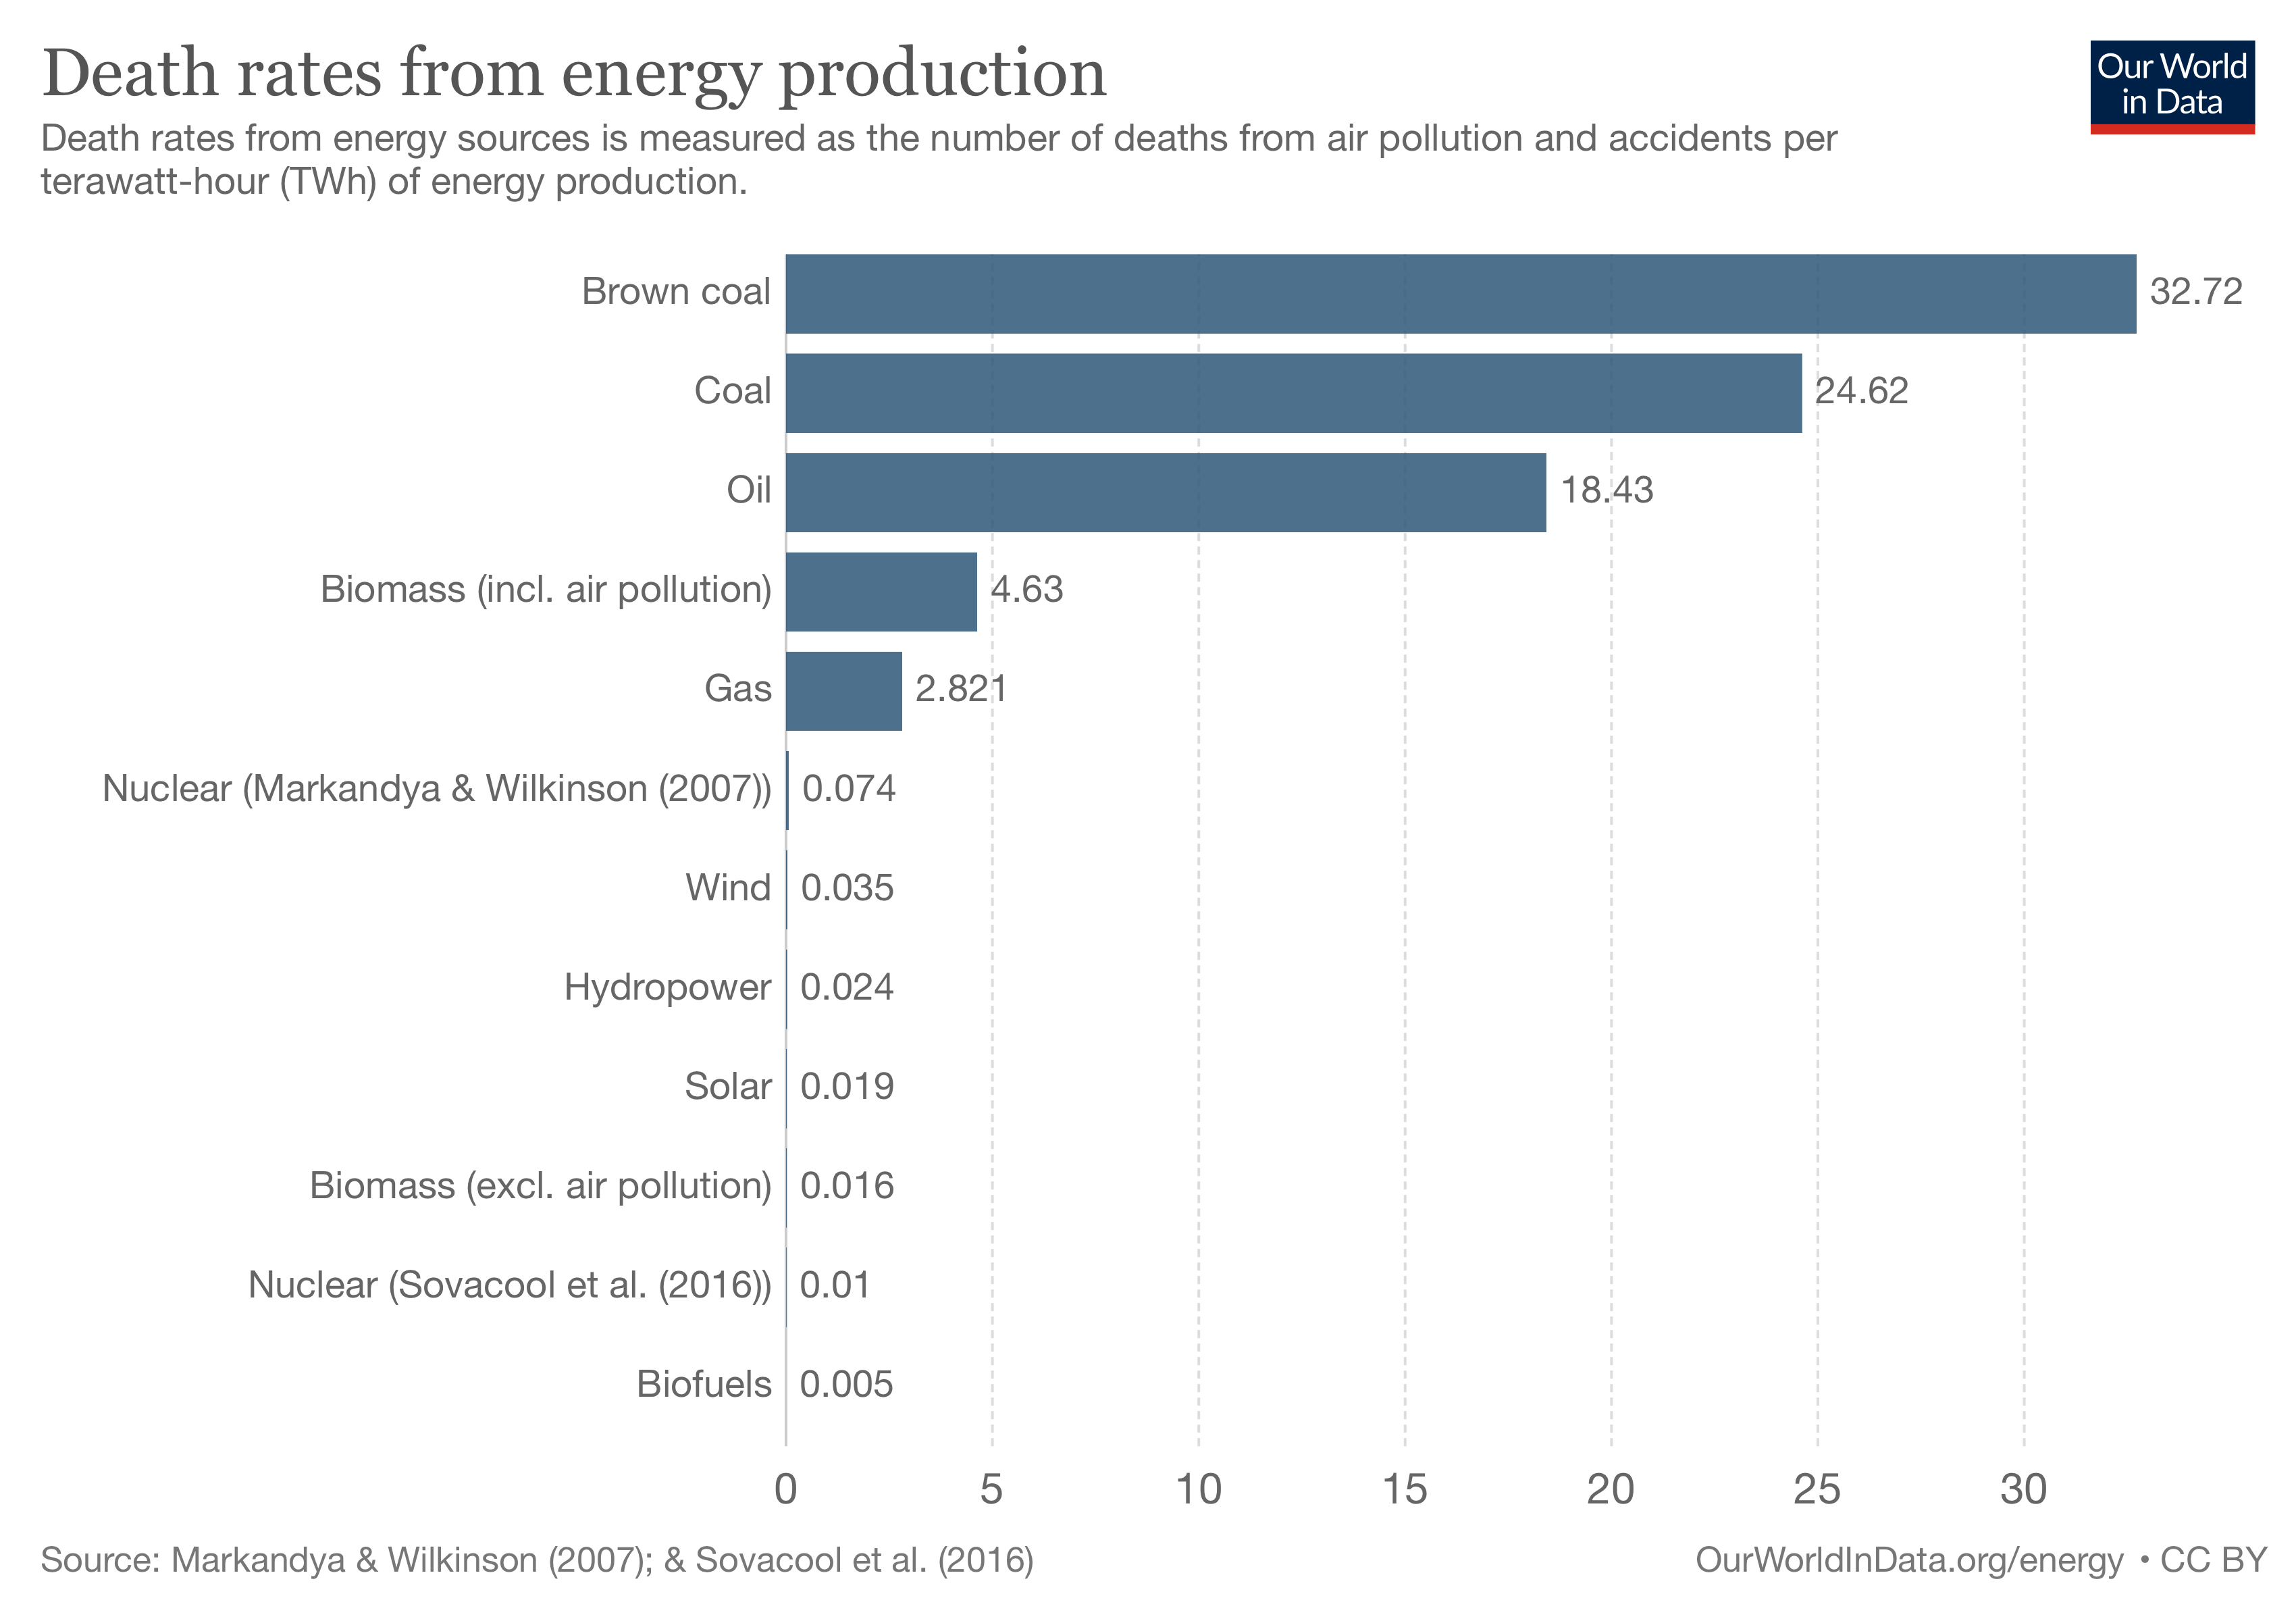  ] .left[<small>**Sources**: [Hirschberg et al. (2015)](https://doi.org/10.1002/9781118991978.hces070) | [Stamford (2020)](https://www.sciencedirect.com/science/article/pii/B9780128155813000051) | [OWD (2020)](https://ourworldindata.org/safest-sources-of-energy)</small>]